Survey Fatigue: What It Is and How to Design Surveys That Avoid It

Samee
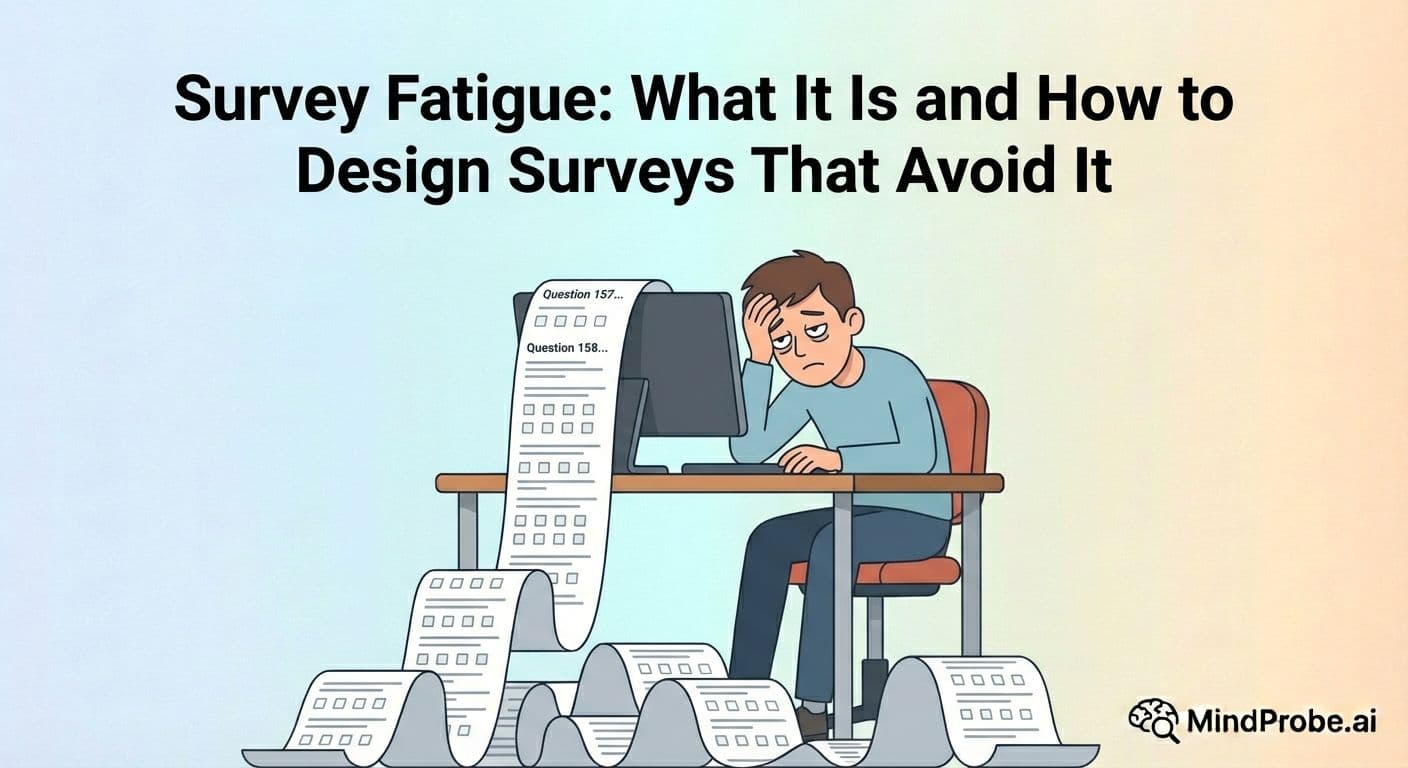
Survey fatigue is a decline in respondent engagement that damages your data quality before it damages your response rates. Here is how to spot it, prevent it and design surveys that respect your audience.
Your response rates are declining. Open-text answers are getting shorter. More people abandon the survey halfway through. Someone on your team mentions that respondents seem tired of surveys.
They are probably right. Survey fatigue is one of the most common problems in market research and customer feedback programmes, and it is also one of the most underestimated. It gets worse as companies increase the number of surveys they send without adjusting their design or frequency. And the real damage is not the lower response rates you can see in your dashboard. It is the worse data you are getting from respondents who technically complete the survey but have mentally checked out by question eight.
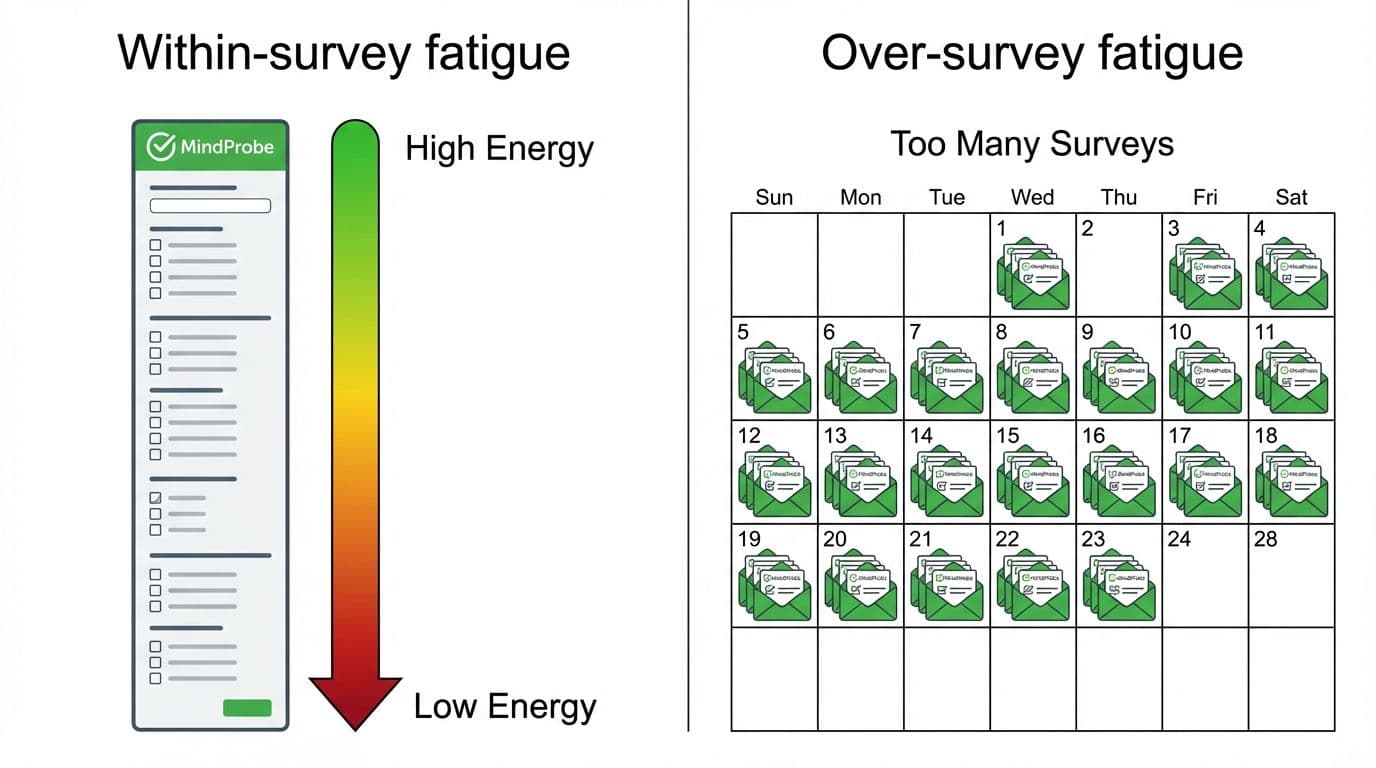
Key takeaway: Survey fatigue has two forms: within-survey fatigue (caused by long or poorly designed surveys) and over-survey fatigue (caused by surveying the same people too often). Both erode data quality before they visibly affect response rates.
What is survey fatigue?
Survey fatigue is a decline in respondent engagement that leads to lower response rates, more incomplete submissions, more careless answers and poorer data quality overall. The term covers two related but distinct problems, and the distinction matters because they require different fixes.
Within-survey fatigue
This happens during a single survey session. The respondent opens the survey, starts answering, and gradually loses interest as the questions keep coming. The symptoms are predictable: they start straight-lining through matrix questions (selecting the same answer for every row without reading), giving single-word open-text responses, or simply closing the tab and moving on with their day.
A 2018 study in the Journal of Business Research measured this effect directly. Cape (2018) found that data quality deteriorated measurably after the 15-minute mark, with satisficing behaviour (choosing the easiest rather than the most accurate answer) increasing sharply in the final third of longer surveys. The respondent is still clicking buttons, but what they are producing is noise dressed up as data.
Within-survey fatigue is driven by length, repetition and irrelevance. A survey that asks 30 questions when 12 would do, or that forces a respondent to rate 8 features they have never used, is creating its own fatigue problem.
Over-survey fatigue (respondent fatigue)
This happens across multiple surveys over time. When an organisation sends too many surveys too frequently, respondents begin ignoring them entirely. They stop opening survey invitation emails. They start unsubscribing from communications. They develop a reflexive "not another one" response to anything that looks like a feedback request.
A 2021 Qualtrics report found that 70% of consumers had abandoned at least one survey in the previous 12 months, with frequency being the most commonly cited reason. Gartner's Customer Experience practice (2022) projected that brand-initiated survey opt-out rates would continue to rise unless companies made significant changes to their survey frequency and design practices.
The irony is that the teams sending the most surveys are usually the ones with the best intentions. They want customer input. They want data-driven decisions. But without discipline on frequency, the surveys themselves become a source of customer friction, the exact opposite of what a feedback programme should achieve.
How to spot survey fatigue in your data
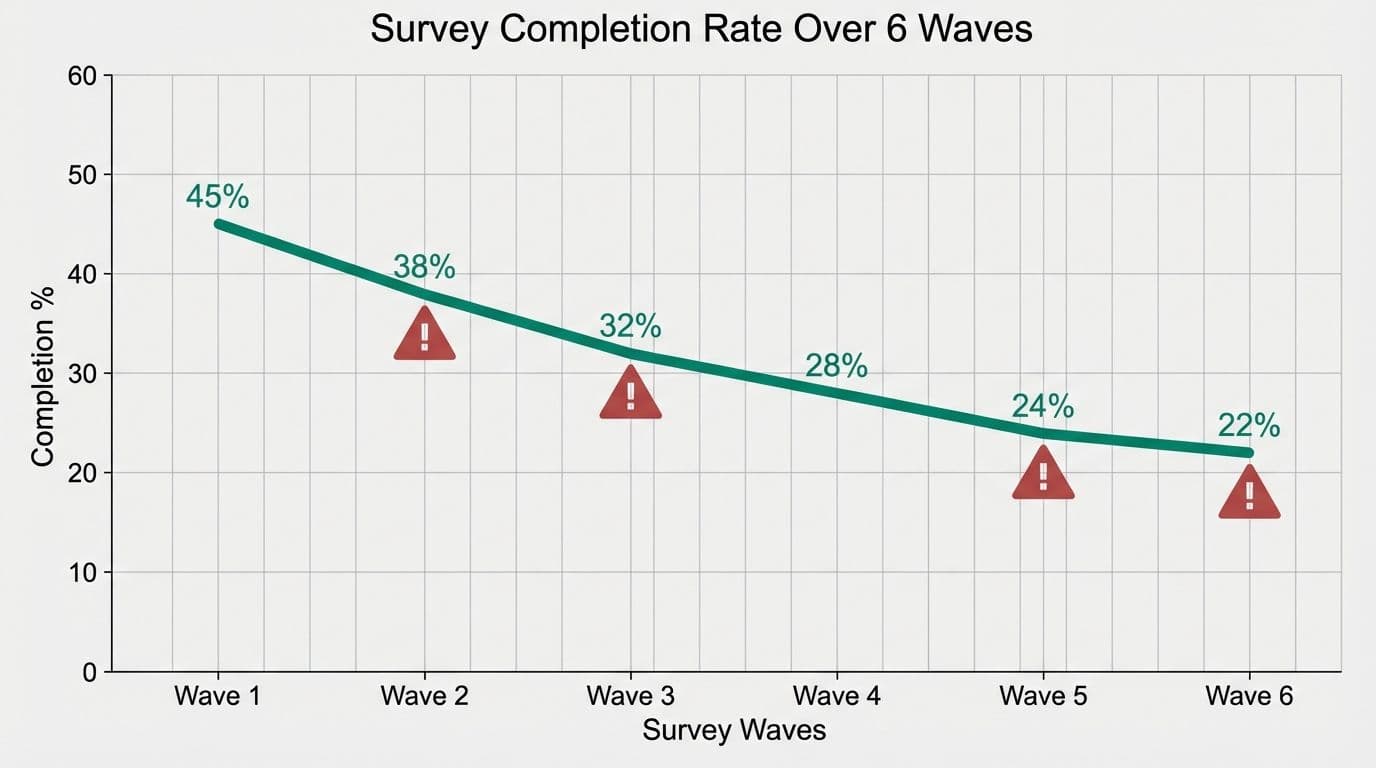
Survey fatigue rarely announces itself with a single dramatic drop. It accumulates gradually across multiple metrics, and you only notice it when someone looks at trends over time rather than individual survey results.
• Completion rates declining across successive survey waves, even though your distribution list size is stable or growing.
• Straight-line response patterns increasing in grid or matrix questions, particularly in the second half of the survey.
• Open-text response length decreasing compared to earlier surveys using similar questions.
• Drop-off rates concentrating in the second half of the survey rather than being evenly distributed.
• Time-to-complete decreasing faster than question count, which suggests respondents are rushing rather than reading.
• Unsubscribe rates on survey invitation emails rising relative to your baseline.
• The gap between email open and survey start widening, which means people are reading the invitation and deciding not to bother.
If you observe three or more of these patterns simultaneously, survey fatigue is very likely a contributing factor. Look at trends over the last three to six months rather than comparing individual surveys.
10 ways to prevent survey fatigue
1. Shorten your surveys. This is the single most effective change you can make. Most B2C surveys should take under 5 minutes, which means 8 to 12 questions for a typical mix of question types. For every question in your draft, ask: "Will I make a different decision based on the answer to this?" If the answer is no, remove it. Nice-to-know questions are the primary driver of survey bloat, and they cost you completions and data quality on the questions that actually matter.
2. Use skip logic to remove irrelevant questions.
3. Coordinate survey frequency across teams. Sending a post-purchase survey, an NPS survey and a product feedback survey to the same customer in the same month is too much. The customer does not see three separate teams asking for input. They see one company pestering them. Create a shared survey calendar across marketing, product, customer success and HR, and set a maximum number of survey invitations any individual can receive in a given period. One per month is a reasonable ceiling for most B2C relationships.
4. Set expectations upfront. Tell respondents how long the survey will take before they begin. "This takes about 3 minutes" in the invitation email or on the survey landing page reduces abandonment because people can decide upfront whether they have time. The surprise of a survey that turns out to be much longer than expected is what triggers frustration and drop-off. Transparency removes that surprise.
5. Vary your question types. A survey with 20 Likert-scale rows in succession is exhausting, even if the content is relevant. Mix single-choice questions, star ratings, dropdown selectors, slider scales, ranking exercises and the occasional open-text field. Variety in format keeps respondents mentally engaged and reduces the autopilot effect that leads to straight-lining.
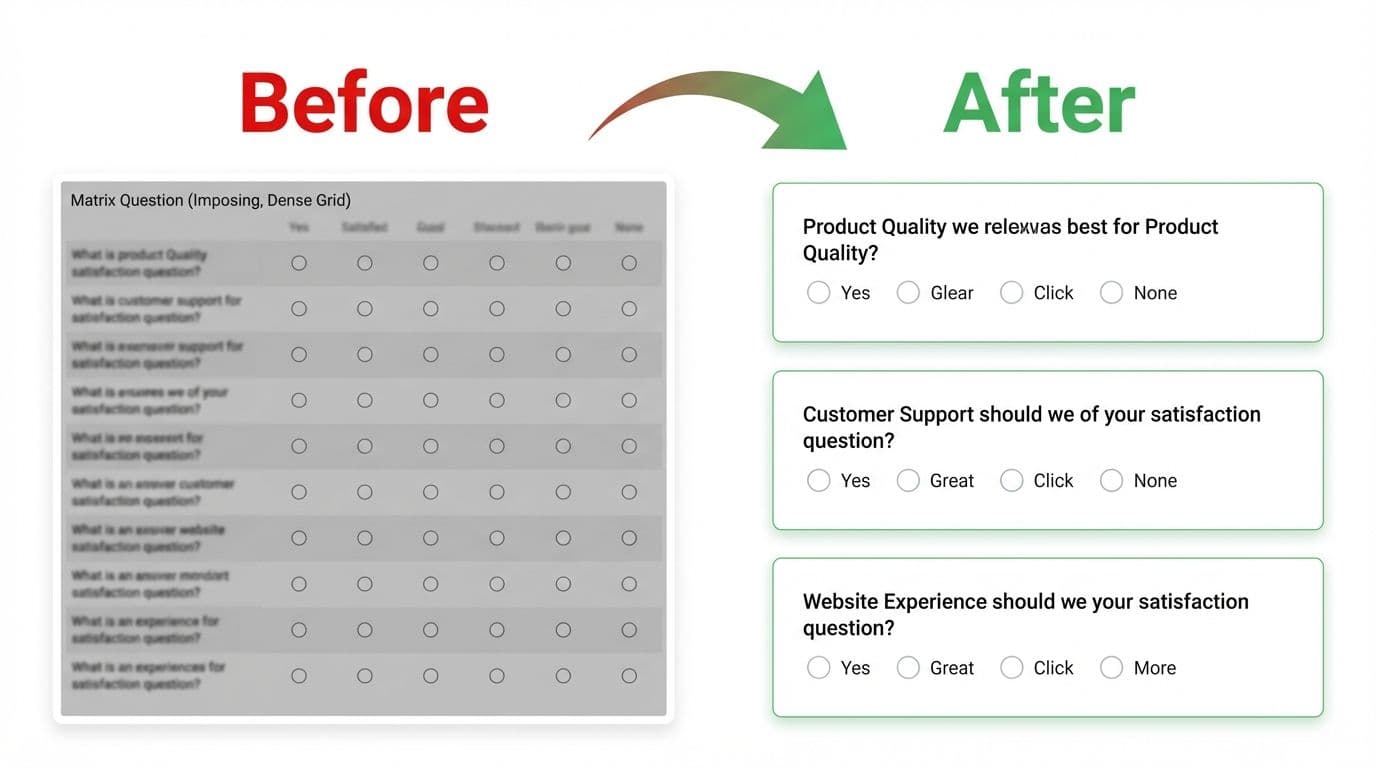
6. Minimise matrix questions. Matrix or grid questions are the single biggest driver of within-survey fatigue. They look imposing on screen (especially on mobile, where they often require scrolling), and respondents consistently satisfice through them. If you must use a matrix, limit it to 5 rows at most. Where possible, split the matrix into individual questions. It adds a few more screens but the data you collect is more reliable.
7. Brand your survey properly. A professional, branded survey signals that the sender is legitimate and that the data will be used thoughtfully. Respondents who trust the source are more willing to invest time in careful answers. An unbranded survey with a generic URL sends the opposite message: this is impersonal, mass-produced, and my input probably will not change anything.
8. Optimise for mobile. More than 60% of survey responses come from mobile devices (Statista, 2024). A survey that is difficult to complete on a phone, with tiny tap targets, horizontal scrolling, slow load times, or text so small it requires pinching and zooming, drives abandonment and frustration. Test every survey on a real device before sending it.
9. Use an accurate progress bar. Respondents who can see how close they are to finishing are more likely to complete the survey. But the progress bar needs to be honest. One that jumps erratically or stalls near the end actively increases frustration. If your tool calculates progress by page count rather than question count, make sure each page has a roughly equal number of questions so the bar feels smooth.
10. Close the feedback loop. When people see that their previous survey responses led to real changes, they are more willing to participate next time. A brief follow-up ("You told us X was a problem, so we fixed it" or "Based on your feedback, we launched Y") transforms a transactional data collection exercise into a relationship. People who feel heard do not experience fatigue in the same way. Closing the loop is the most effective long-term prevention strategy.
What survey fatigue actually costs you
The visible cost of survey fatigue is fewer complete responses. The hidden cost, and the more damaging one, is worse data from the people who do respond. Fatigued respondents click through rating scales without reading the items. They skip open-text fields or type "fine" instead of a real answer. They give you a dataset that looks complete and valid in your dashboard but is actually full of noise. You then make product decisions, marketing strategy changes and budget allocations based on that noise, without ever knowing it was unreliable.
For practical strategies to maintain healthy participation rates, see How to Improve Survey Response Rates: 14 Proven Tactics. For a comprehensive framework on building surveys that respect respondents' time from end to end, read The Complete Guide to Online Surveys and Online Survey Best Practices.
Design shorter, smarter surveys with MindProbe. Try it free at mindprobe.ai
Frequently asked questions
References: Cape, P. (2018). Questionnaire length, fatigue effects and response quality revisited, Journal of Business Research, 98, 162-171. Qualtrics (2021). Global consumer trends in survey participation report. Gartner (2022). Predicts: Customer experience management. Statista (2024). Mobile device share in online survey completion worldwide.