Online Survey Best Practices: 12 Things That Separate Good Surveys From Bad Ones

Samee
Most surveys are too long, poorly designed and visually generic. Here are 12 practices that consistently separate useful surveys from forgettable ones, backed by published research.
Most surveys are mediocre. They are too long, poorly worded, visually generic and distributed with no thought to timing or channel. The data they produce is thin, noisy and difficult to act on. And the teams that build them rarely find out, because nobody tells you when your survey is bad. People just close the tab.
Good surveys are shorter than you think they need to be. They ask one thing at a time, look professional, feel relevant to the person taking them, and respect the respondent's time at every step. Below are 12 practices that consistently separate useful surveys from forgettable ones. These are drawn from published research in survey methodology and from practical experience running survey programmes for B2C and SaaS marketing teams.
Key takeaway: The difference between a good survey and a bad one is usually not the questions themselves. It is survey length, visual design, mobile rendering and distribution timing. Get those four things right and most other problems become manageable.
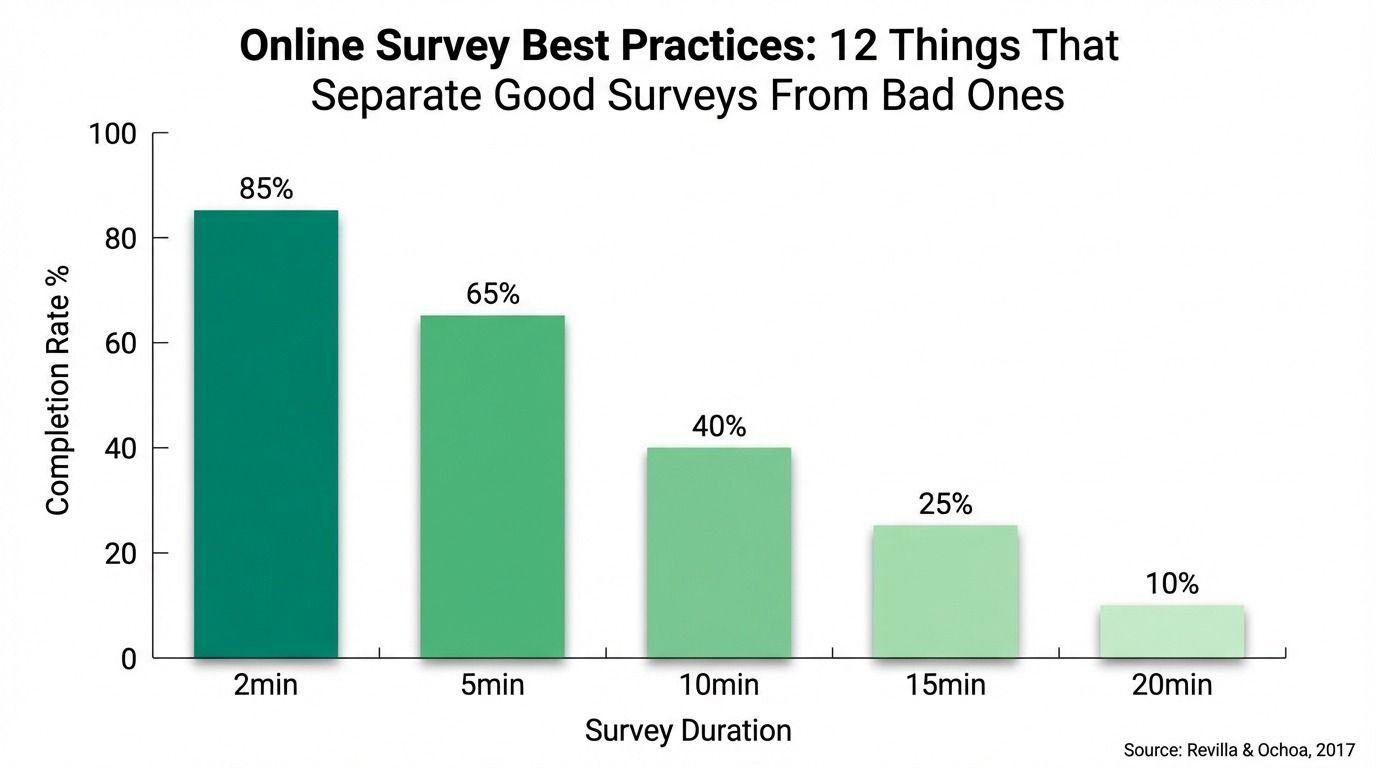
- Keep it under 5 minutes. A meta-analysis by Revilla and Ochoa (2017) in the International Journal of Market Research found that response rates dropped by approximately 17% for every additional 5 minutes of survey length. For most B2C research, that means aiming for 8 to 12 questions. If your draft has 25, you are probably trying to answer too many research questions in a single survey. Split it into two shorter surveys and run them a week apart. You will get better data from each.
Here is a practical test: time yourself completing the survey at a normal pace. If it takes you more than 4 minutes, and you are the person who wrote the questions and already knows the answers, it will take your respondents 6 to 8 minutes. Cut until it is under 5.
2. Start with easy, low-effort questions. Open your survey with simple items that build momentum. A yes/no question, a single rating scale, or a quick multiple choice requires almost no cognitive effort. Save the open-text fields, matrix grids and complex ranking questions for later, once respondents have already invested 30 seconds and feel committed to finishing.
The psychology here is straightforward: people who have started something are more likely to complete it. This is the sunk cost effect working in your favour. Get respondents past the first two questions with minimal friction, and your completion rate improves.
3. Ask one thing at a time. Double-barrelled questions produce unusable data. "How satisfied are you with our product quality and customer service?" is a single question about two separate topics. If a respondent gives a score of 6, you cannot tell whether they are slightly unhappy with both, delighted with one and frustrated with the other, or just averaging two very different feelings.
The fix is simple: split it into two questions. "How satisfied are you with product quality?" and "How satisfied are you with customer service?" Your analysis becomes immediately more actionable because you know exactly which area needs attention.
4. Use skip logic to remove irrelevant questions.
A 25-question survey with well-designed skip logic might show only 10 to 15 questions to any individual respondent. That is a meaningful reduction in perceived effort without any loss of information.
5. Brand your survey. An unbranded survey with a generic URL looks like a phishing attempt. Add your logo, match your brand colours, use a custom survey domain. A 2020 study by Dillman, Smyth and Christian found that visual consistency between the invitation email and the survey itself raised completion rates by up to 12 percentage points. For a 10,000-person distribution list, that translates to 1,200 additional complete responses from a change that takes minutes to implement.
Branding is not just about looking professional. It is about trust. When respondents recognise the sender, they are more willing to share honest feedback. When they do not recognise it, they give shorter answers or abandon entirely.
6. Optimise for mobile from the start. SurveyMonkey's 2023 benchmarking report found that over 60% of survey responses are now submitted on mobile devices. If your survey requires horizontal scrolling, uses tiny radio buttons, relies on hover states, or loads slowly over a mobile connection, you will lose respondents before question three.
The practical rule: design mobile-first, then check how it looks on desktop. Not the other way around. Test on a real phone, not just a browser emulator. Pay attention to tap targets (buttons should be at least 44 pixels), font sizes (anything under 14px is hard to read on a phone), and page load speed on a 4G connection.
7. Write neutral, unbiased questions."How much did you enjoy our new feature?" assumes the respondent enjoyed it. "How would you describe your experience with our new feature?" is neutral and allows for negative responses without making the respondent feel like they are contradicting the question itself.
Leading questions produce biased data, and biased data is worse than no data because it gives you false confidence. You make decisions thinking you have evidence, when what you actually haveis a reflection of how the question was worded. Read each question aloud and ask: does this assume a particular answer? If it does, rewrite it.
8. Show a progress bar. Respondents who can see how far along they are complete surveys at higher rates. A meta-analysis by Villar, Callegaro and Yang (2013), published in Social Science Computer Review, found that progress indicators reduced break-off rates, particularly in surveys longer than 10 minutes.
One important caveat: the progress bar must be accurate. A bar that jumps from 10% to 80% and then stalls at 95% for three more questions actually increases frustration and drives drop-off. If your tool calculates progress by page count rather than question count, and some pages have more questions than others, the bar will feel dishonest.
9. Time your distribution carefully.
Send time is one of the easiest variables to test. Run the same survey with two send times and compare open rates and completion rates. Over a few survey waves, you will find the window that works best for your specific audience.
10. Send reminders, but not too many. A single well-timed reminder typically recovers 20 to 30% of initial non-responders. Send it 3 to 5 days after the original invitation. Use a slightly different subject line ("Quick reminder" rather than forwarding the same email) and keep the tone light. Two reminders are acceptable for important research. Three starts to feel aggressive and risks triggering unsubscribes that hurt your future surveys.
11. Test every path before you launch. Send the survey to yourself and at least two colleagues. Check question clarity, every skip logic path, mobile rendering, page load speed and total completion time. Every survey should be tested on an actual phone, not just previewed in a desktop browser window.
Ask your testers to think aloud while they complete the survey. Where do they hesitate? Which questions do they re-read? Where do they seem confused? Those moments of friction are exactly what causes real respondents to abandon.
12. Close the feedback loop.
This does not need to be elaborate. A short email, a banner in your app, or a note at the top of your next survey that says "Last time, you told us Y was a problem. Here is what we did about it" is enough. The message is: your input matters, and we are listening.
A pre-launch checklist
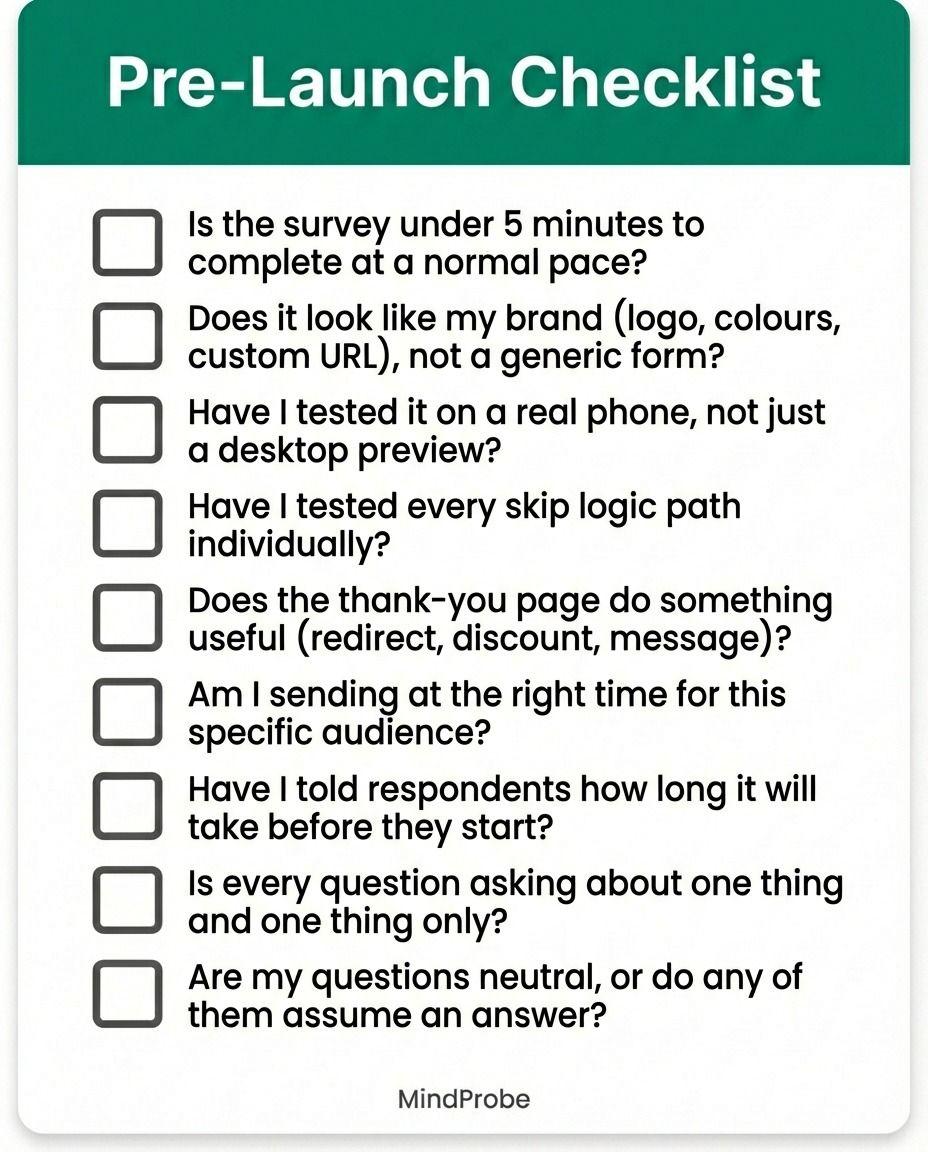
Before you send any survey, run through this list. It takes two minutes and catches the most common errors.
- Is the survey under 5 minutes to complete at a normal pace?
- Does it look like my brand (logo, colours, custom URL), not a generic form?
- Have I tested it on a real phone, not just a desktop preview?
- Have I tested every skip logic path individually?
- Does the thank-you page do something useful (redirect, discount, message)?
- Am I sending at the right time for this specific audience?
- Have I told respondents how long it will take before they start?
- Is every question asking about one thing and one thing only?
- Are my questions neutral, or do any of them assume an answer?
For a deeper dive into the full survey lifecycle, from research question through analysis and reporting, read The Complete Guide to Online Surveys. If low completion rates are a persistent problem across your programme, see How to Improve Survey Response Rates: 14 Proven Tactics.
Build better surveys with MindProbe. Start free at mindprobe.ai
Frequently asked questions
How long should an online survey be?
Aim for 5 minutes or fewer, which typically translates to 8 to 12 questions for most B2C research. Response rates drop measurably with every additional minute of survey length. If you need more depth, split the research across two shorter surveys and run them sequentially rather than packing everything into one.
What is the ideal number of questions in a survey?
There is no universal ideal, but 8 to 12 questions is the range that balances data richness with completion rates for most marketing research. Use skip logic to keep the effective question count low for each individual respondent, so different audience segments see only what is relevant to them.
Should I offer incentives for completing my survey?
Incentives can boost response rates by 10 to 20%, but they also attract respondents who rush through for the reward rather than giving thoughtful answers. Lottery-style incentives (a chance to win rather than a guaranteed payment) tend to produce better data quality. If you use guaranteed incentives, screen for satisficing behaviour in your analysis.
How do I know if my survey questions are biased?
Read each question aloud and check whether it assumes a particular answer. "How much did you enjoy..." assumes enjoyment. "How would you rate..." is neutral. Pilot-test with 5 to 10 people outside your team and ask them to flag anything that feels leading, confusing, or loaded.
What is the best day and time to send a survey?
For B2B audiences, Tuesday to Thursday mornings (9am to 11am local time) tend to perform best. For B2C, test weekday evenings and weekend mornings. The optimal window varies by audience, so run a few tests with different send times and track completion rates to find what works for your specific list.
References: Revilla, M. & Ochoa, C. (2017). Ideal and maximum length for a web survey, International Journal of Market Research, 59(5), 557-565. Villar, A., Callegaro, M. & Yang, Y. (2013). Where am I? A meta-analysis of experiments on the effects of progress indicators for web surveys, Social Science Computer Review, 31(6), 744-762. Dillman, D.A., Smyth, J.D. & Christian, L.M. (2020). Internet, Phone, Mail and Mixed-Mode Surveys: The Tailored Design Method, 5th edition, Wiley. SurveyMonkey (2023). Global survey response benchmarks.