How to Improve Survey Response Rates: 14 Proven Tactics

Samee
The average external survey response rate is 10 to 30%. Here are 14 tactics backed by academic research and field experience that consistently move that number higher.
Low response rates are the most common frustration in survey research. You write the questions, build the survey, send it to your distribution list, and then watch as the majority of your audience ignores it completely.
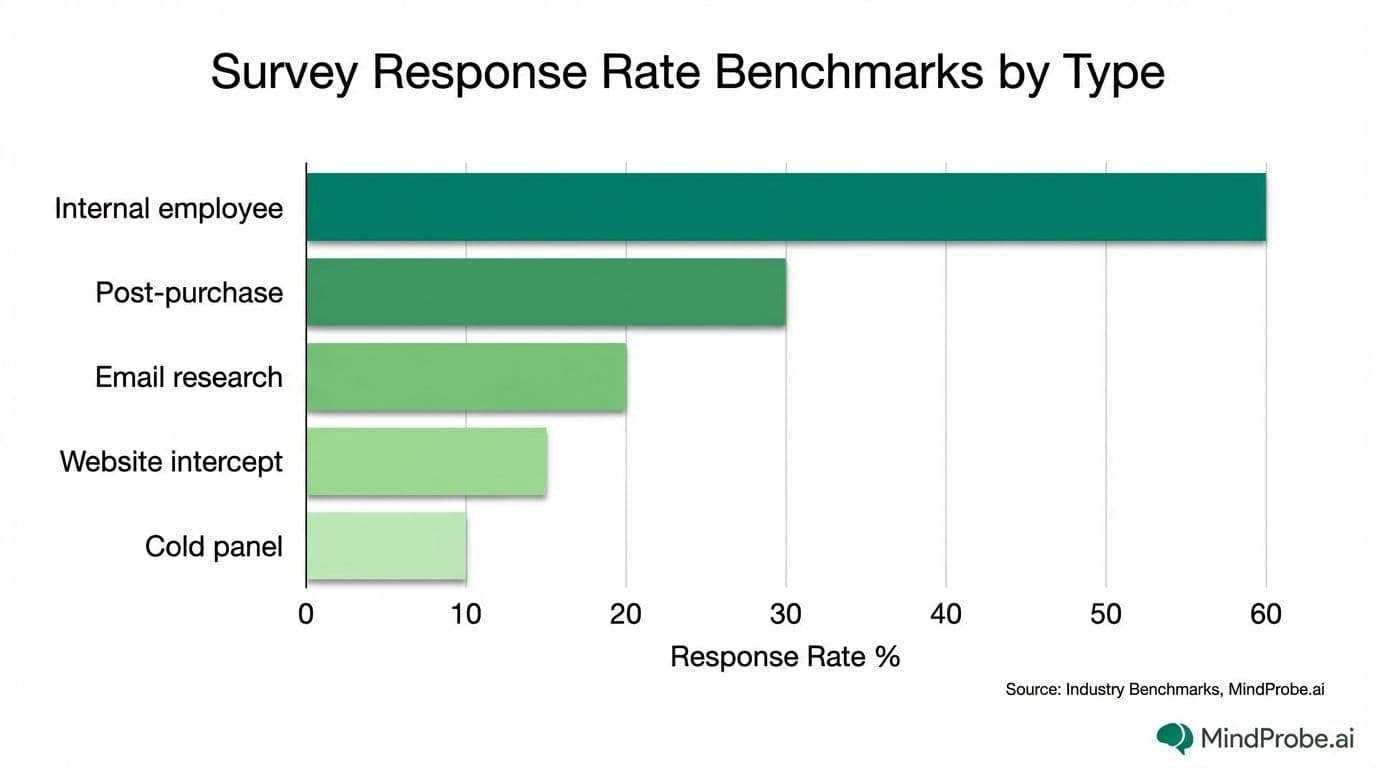
The average response rate for external customer surveys sits between 10% and 30%, depending on audience relationship, distribution channel, industry and survey design (Baruch & Holtom, 2008). For internal employee surveys, rates tend to be higher, typically 50 to 70%, but those numbers have been declining year over year across most industries and company sizes.
Below are 14 tactics that consistently move the needle on survey response rates. Each is supported by academic research, industry benchmarking data or direct field experience running survey programmes for B2C and SaaS marketing teams. They are ordered roughly by impact and ease of implementation.
Key takeaway: Survey response rates are driven by three factors: trust (does the respondent recognise the sender and believe the request is legitimate?), effort (how long will this actually take?) and motivation (why should they bother?). Nearly every effective tactic targets one of these three.
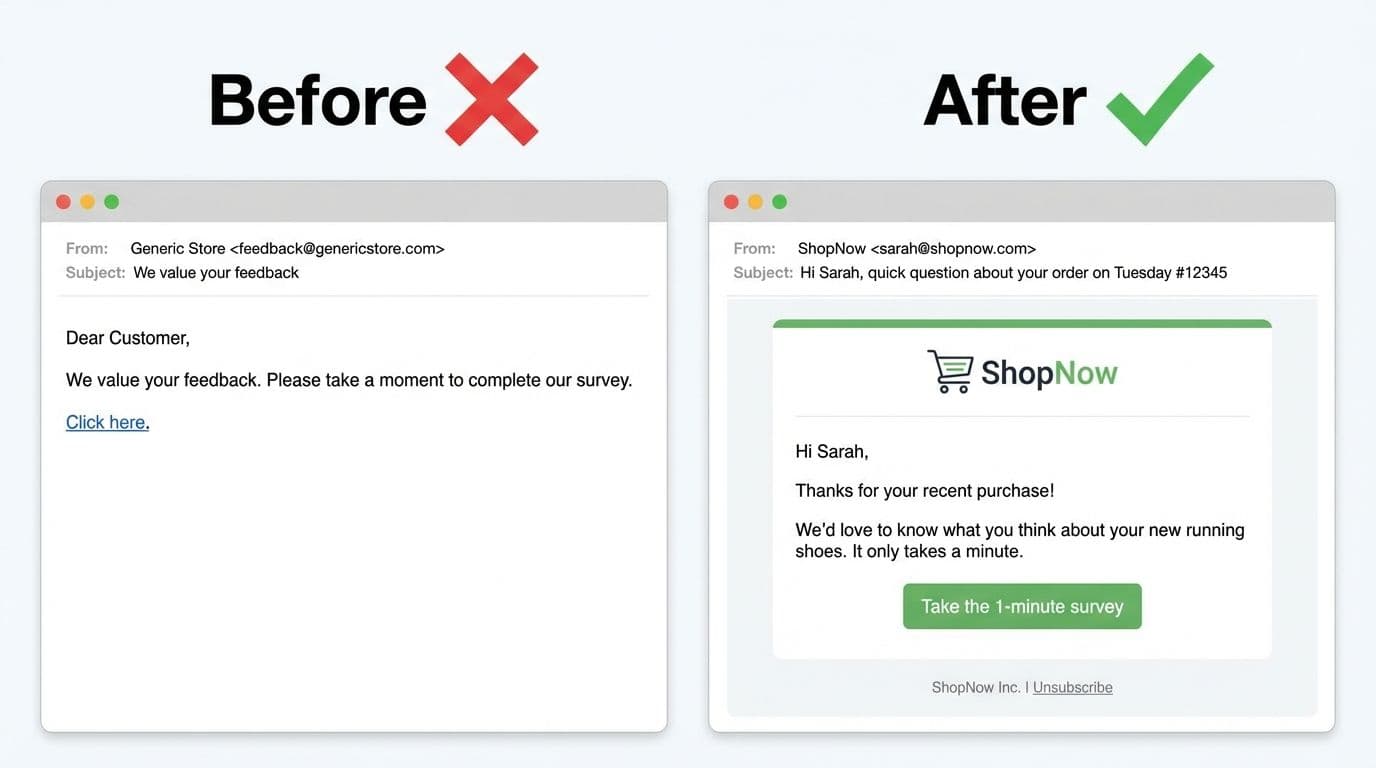
1. Personalise the invitation email. Use the respondent's name in the subject line and greeting. A meta-analysis by Edwards et al. (2009), covering 32 web survey experiments across multiple countries and industries, found that personalised invitations increased response rates by 7.8 percentage points on average. That gain compounds: a personalised email is more likely to be opened, and a person who opens the email is more likely to click through and start the survey.
Personalisation goes beyond the name. If you can reference the respondent's recent activity ("a quick question about your order last Tuesday"), the invitation feels relevant rather than generic. This matters especially for large distribution lists where most emails feel mass-produced.
2. Keep the survey short.
3. Write a specific, honest subject line. The subject line determines whether your email gets opened. "Quick question about your recent order" outperforms "We value your feedback" because it sets a clear, specific expectation. The respondent knows what you are asking about and can gauge whether it is relevant to them.
Avoid spam-trigger words: "free," "win," "exclusive," "claim," "limited time." Keep subject lines under 50 characters so they display fully on mobile. Be direct about what you are asking and, if possible, why.
4. Send from a recognisable name. Emails from "Company Name" or "Sarah at Company Name" get opened more frequently than emails from "noreply@surveytool.com" or "research@surveys.net." According to Litmus's 2023 State of Email report, the sendername is the single biggest factor in email open rates, more influential than subject line or preview text. Use a name your audience will recognise and trust.
5. Brand the entire survey experience.
Branding is a trust signal. It tells the respondent: this is real, this is from us, and we care enough to make it look right. An unbranded survey with a generic URL does the opposite.
6. Choose the right send time. For B2B audiences, send Tuesday to Thursday between 9am and 11am in the respondent's local time zone. For B2C, test weekday evenings (6pm to 9pm) and weekend mornings (9am to 11am). Monday mornings consistently underperform because of inbox overload. Friday afternoons underperform because people are mentally checked out for the week.
Send time is one of the simplest variables to A/B test. Split your list in half, send to each group at a different time, and compare open rates and completion rates. Over two or three survey waves, you will have a clear picture of what works for your specific audience.
7. Send a single well-timed reminder. One reminder email typically recovers 20 to 30% of initial non-responders. Send it 3 to 5 days after the original invitation. Use a different subject line (not a forward of the same email) and keep the tone brief and friendly. A second reminder is acceptable for high-stakes research. Three is the absolute maximum, and each additional reminder risks unsubscribes that reduce your list for future surveys.
8. Make the survey mobile-friendly. Over 60% of survey responses now come from mobile devices (SurveyMonkey, 2023). If your survey has radio buttons too small to tap accurately, requires horizontal scrolling on a phone screen, or takes more than 3 seconds to load over a mobile connection, you are losing more than half your potential respondents. Design mobile-first. Test on a real phone. Pay attention to tap target sizes, font readability and page transitions.
9. State the estimated time upfront. In the invitation email, write: "This survey takes about 3 minutes." On the survey landing page, repeat it. This transparency reduces abandonment because respondents can make an informed commitment before they start. Ambiguity ("a few quick questions") creates uncertainty, and uncertain people tend to close the email rather than take the risk.
10. Offer incentives selectively. Incentives boost response rates by 10 to 20% on average. The most common options are charitable donations ("we will donate 1 pound per completed survey"), prize draws ("complete for a chance to win a 50-pound voucher"), and small guaranteed rewards (discount codes, account credits). Each has trade-offs.
Guaranteed incentives produce higher response rates but attract more satisficers, people who rush through to claim the reward. Lottery-style incentives attract fewer pure reward-seekers and tend to produce better data quality. Charitable donations work well for audiences who are already engaged with your brand. Test what works for your audience and always screen completed responses for quality.
11. Use skip logic to shorten the effective survey.
12. Match the channel to the audience.
Using the wrong channel is one of the most common causes of low response rates that teams misattribute to survey design. A perfectly designed survey sent via email to an audience that primarily engages via your app will underperform an average survey delivered in-app at the right moment.
13. Embed the first question in the email. Some survey tools let you display the first question directly in the email body. The respondent can see and begin answering before they even click through to the full survey. This reduces the initial friction of starting, and once someone has answered one question, they are significantly more likely to complete the rest. Even if your tool does not support true email embedding, showing a visual preview of the first question in the email body can have a similar effect.
14. Close the feedback loop. Tell respondents what happened because of their input. "Based on your feedback, we changed X" or "We heard you, and here is what we are doing about Y." This is the single most effective long-term strategy for maintaining healthy response rates across multiple survey waves. People stop responding to surveys when they believe their answers go nowhere. Showing them that their input led to real change reverses that perception.
Closing the loop does not require a separate campaign. A line at the top of your next survey invitation ("Last time, you told us Z was a problem. Here is what we did.") or a short section in your newsletter is enough.
What counts as a "good" response rate?
It depends entirely on context. Here are rough benchmarks to help you calibrate expectations for your programme.
• Internal employee surveys: 50 to 70%
• Post-purchase customer satisfaction (email to existing customers): 20 to 40%
• Relationship research surveys (email to customer database): 10 to 30%
• Cold panel surveys (no prior relationship with respondent): 5 to 15%
• Website intercept or in-app surveys: 10 to 25%
A low absolute response rate is not automatically a problem if your sample is representative of the population you are studying. A 15% response rate from a well-targeted list can produce more actionable data than a 60% rate from a poorly defined one. But a declining response rate across survey waves almost always signals a design or frequency problem worth investigating.
How to measure and track your response rate
The basic formula for response rate is simple: divide the number of completed responses by the number of invitations delivered, then multiply by 100. If you sent 1,000 emails and 250 people completed the survey, your response rate is 25%.
The important detail is the denominator. Use delivered invitations, not sent invitations. If 50 of your 1,000 emails bounced, your denominator is 950, not 1,000. Using the wrong denominator makes your response rate look worse than it actually is and obscures real delivery issues that need fixing separately.
Track response rates over time, not just per survey. A single survey with a 15% response rate tells you very little. But if your last four surveys came in at 28%, 24%, 19% and 15%, you have a clear downward trend that points to either survey fatigue, list quality degradation, or a design problem. That trend is more informative than any single number.
It is also worth tracking your partial completion rate separately. If 400 people started your survey but only 250 finished it, you have a 37.5% drop-off rate. That suggests a within-survey problem: the survey is too long, a particular question is confusing, or something in the design is causing people to abandon. High starts with low completions is a different problem from low starts, and it requires different fixes.
Finally, segment your response rates by channel, audience type and time of send. You might discover that your email surveys get a 25% rate while your in-app surveys get 40%, or that customers acquired in the last 6 months respond at twice the rate of long-standing customers. These breakdowns tell you where to focus your optimisation effort
For the full picture on survey design, distribution and analysis best practices, see The Complete Guide to Online Surveys.
Boost your response rates with MindProbe. Start free at mindprobe.ai
Frequently asked questions
What is a good survey response rate?
For external B2C surveys distributed via email, 20 to 30% is a solid benchmark. Internal employee surveys should target 50% or higher. Response rates vary substantially by channel, audience relationship, survey length and industry.
Do survey incentives really work?
Yes, typically boosting rates by 10 to 20%. However, guaranteed incentives can attract respondents who rush through for the reward. Lottery-style incentives tend to produce better data quality because they attract respondents who are genuinely willing to participate, with the incentive as a bonus rather than the primary motivation.
How many survey reminders should I send?
One reminder is almost always worth sending and typically recovers 20 to 30% of non-responders. Two reminders are acceptable for important research with a firm deadline. Three is the maximum. Beyond that, you risk unsubscribes that reduce your available audience for future surveys.
When is the best time to send a survey email?
For B2B audiences, Tuesday to Thursday mornings (9am to 11am local time) consistently outperform other windows. For B2C, weekday evenings and weekend mornings often work better. The optimal timing varies by audience, so test two or three send times across a few survey waves and compare completion rates.
Does personalising the invitation email really help?
Yes. Personalised invitations have been shown to increase response rates by approximately 8 percentage points on average, according to a meta-analysis of 32 web survey experiments (Edwards et al., 2009). Using the respondent's name and referencing their specific activity makes the email feel relevant rather than mass-produced.
REFERENCE LINKS (sources cited)
• Baruch & Holtom (2008) - Survey response rate trends, Human Relations: https://doi.org/10.1177/0018726708094863
• Edwards et al. (2009) - Cochrane systematic review on response methods: https://doi.org/10.1002/14651858.MR000008.pub4
• Dillman, Smyth & Christian (2020) - Tailored Design Method: https://doi.org/10.1002/9781119263685
• Litmus (2023) - State of Email report: https://www.litmus.com/resources/state-of-email
• SurveyMonkey (2023) - Global benchmarks: https://www.surveymonkey.com/curiosity/survey-benchmarks/