Loading...
Monitor Your Metrics Live with BI Dashboards
Instantly visualize survey and behavioral data no manual exports.
Forget manual exports, see results update instantly on interactive dashboards that keep stakeholders aligned.
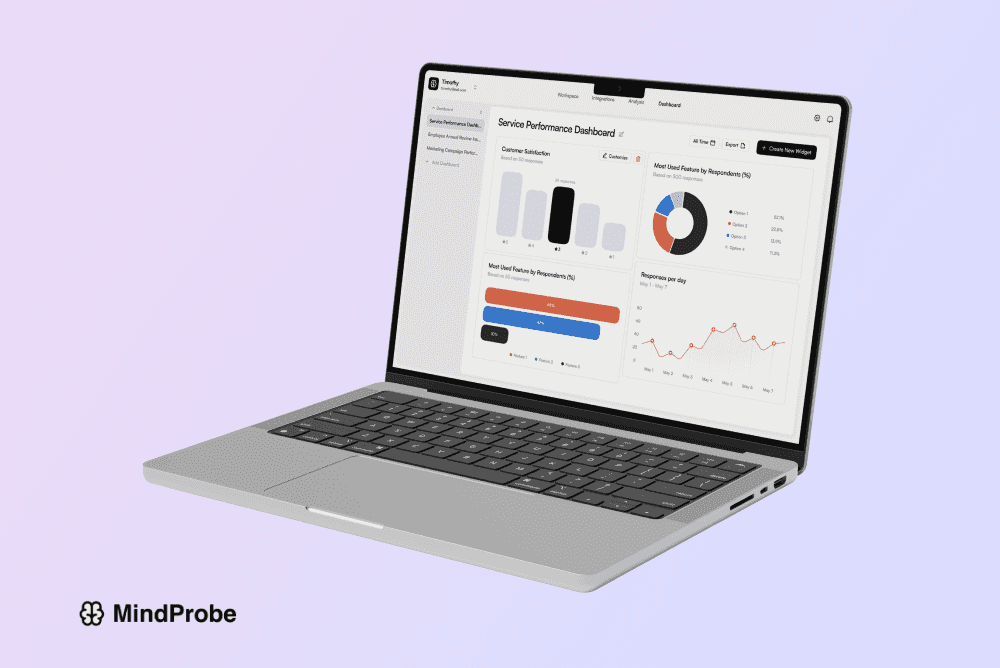
Monitor Your Metrics Live with BI Dashboards
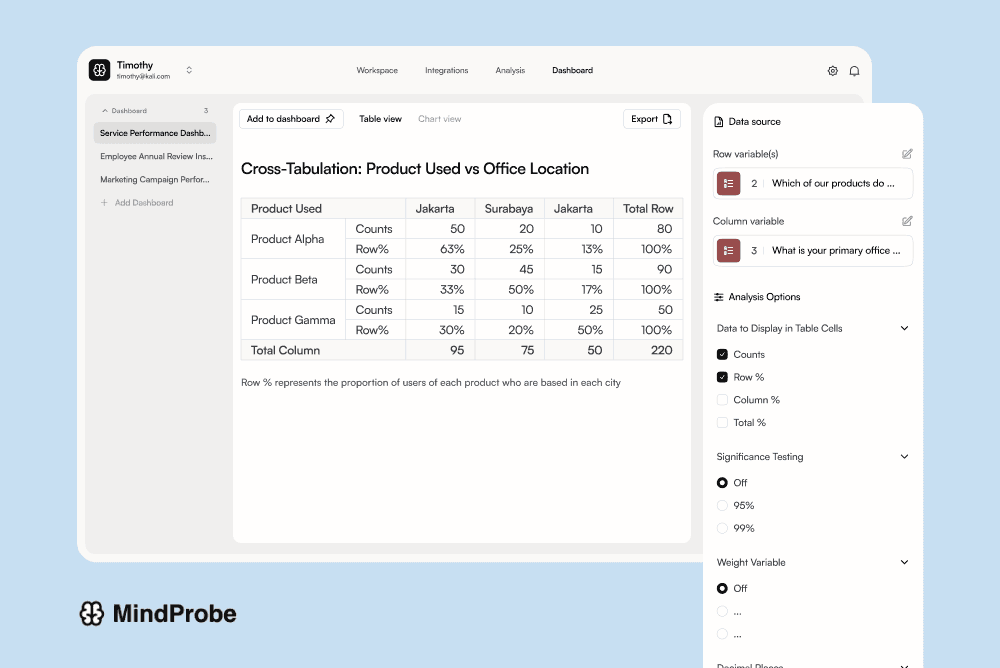
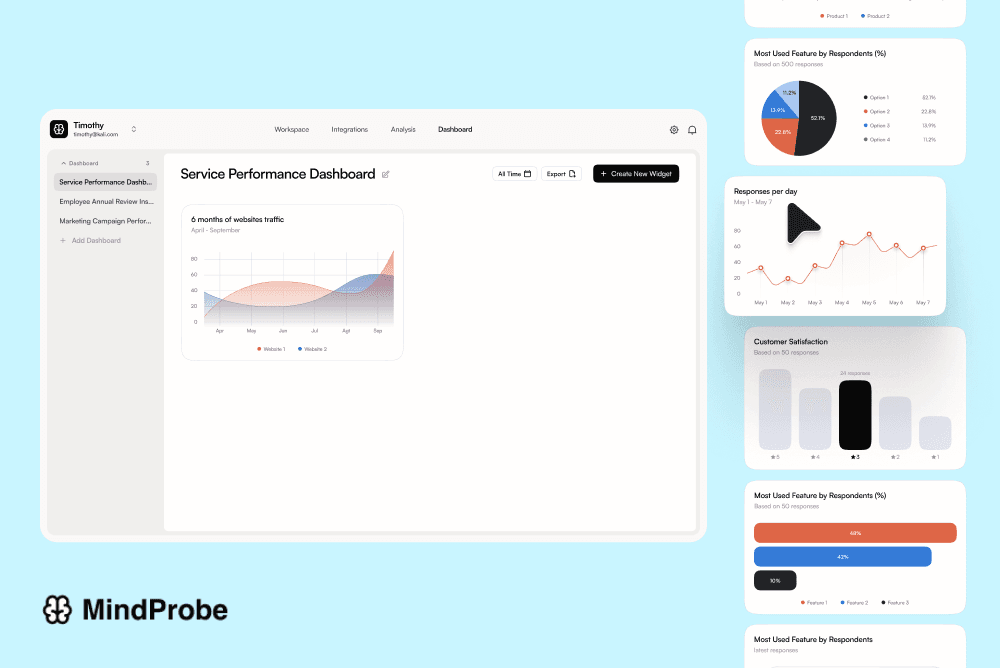
Multi Survey Analysis
Build a dashboard analyzing multiple survey and results
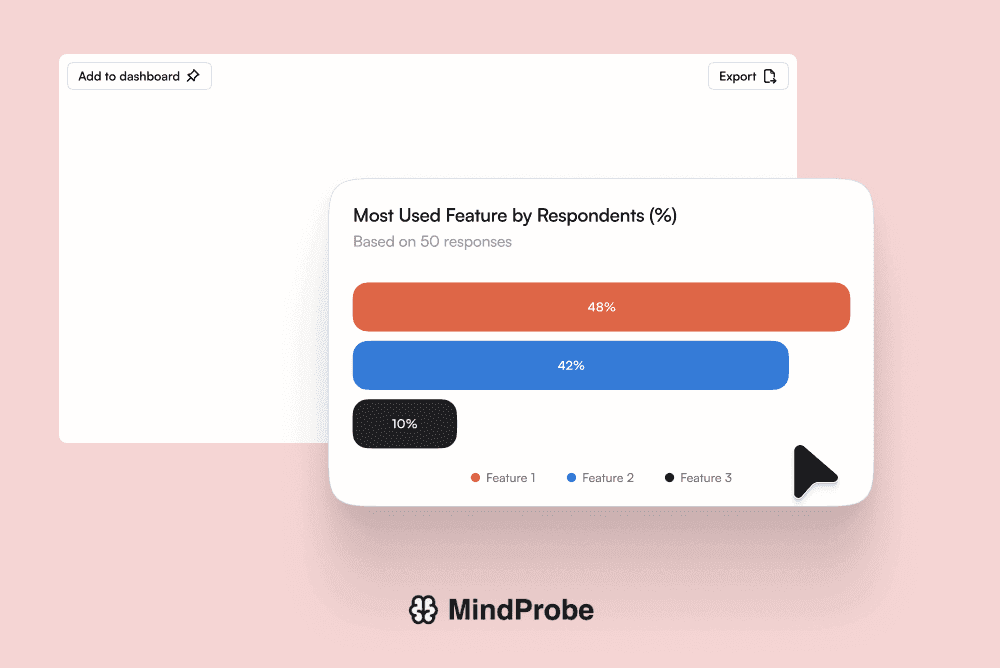
Drag-and-Drop Widgets
Choose from bar, line, pie, and heatmap widgets. Resize, reorder, and configure filters on the fly to spotlight the metrics that matter most.
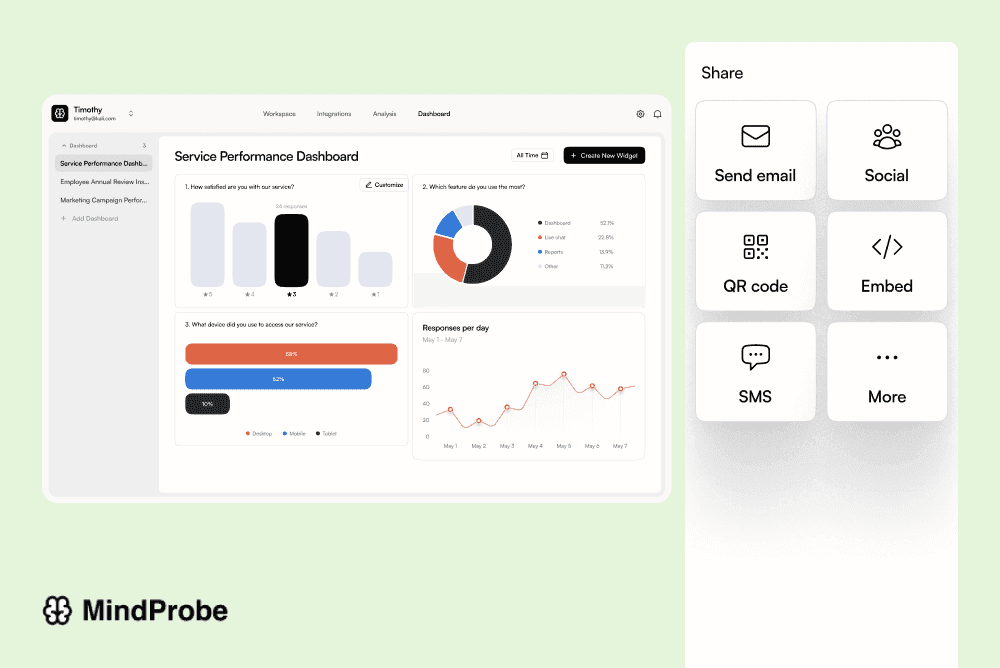
Collaborative Reports
Share live dashboards with stakeholders via secure links or embed them in your intranet. Set permission levels view or edit for team alignment.
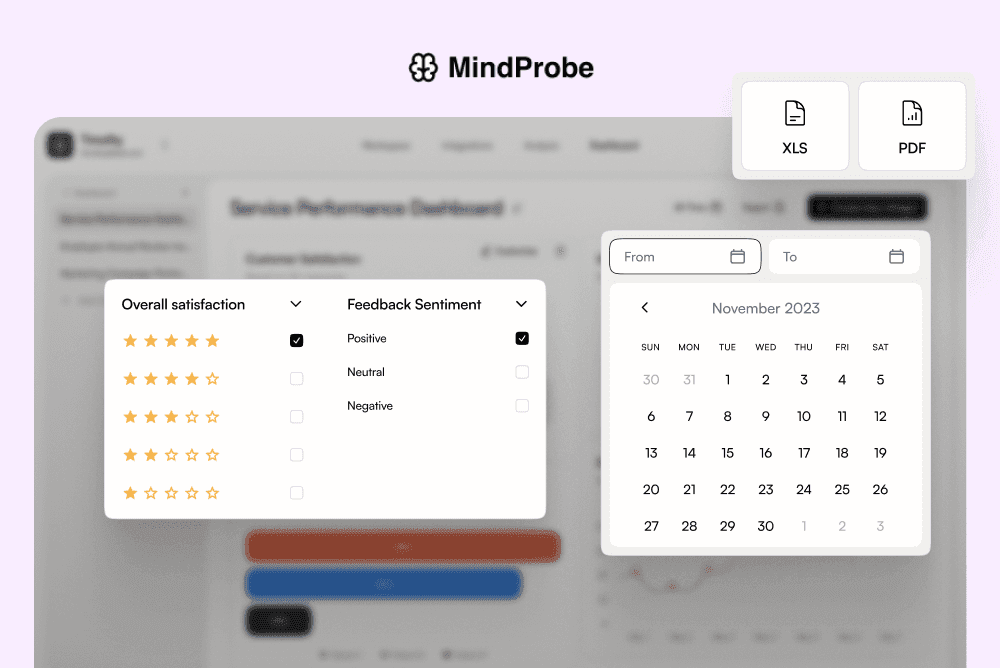
Custom Filters
Slice and dice by date, response, or segment on any chart.
Full Customization
Tailor your dashboard to what you want to see. Across multi-surveys
Annotations & Alerts
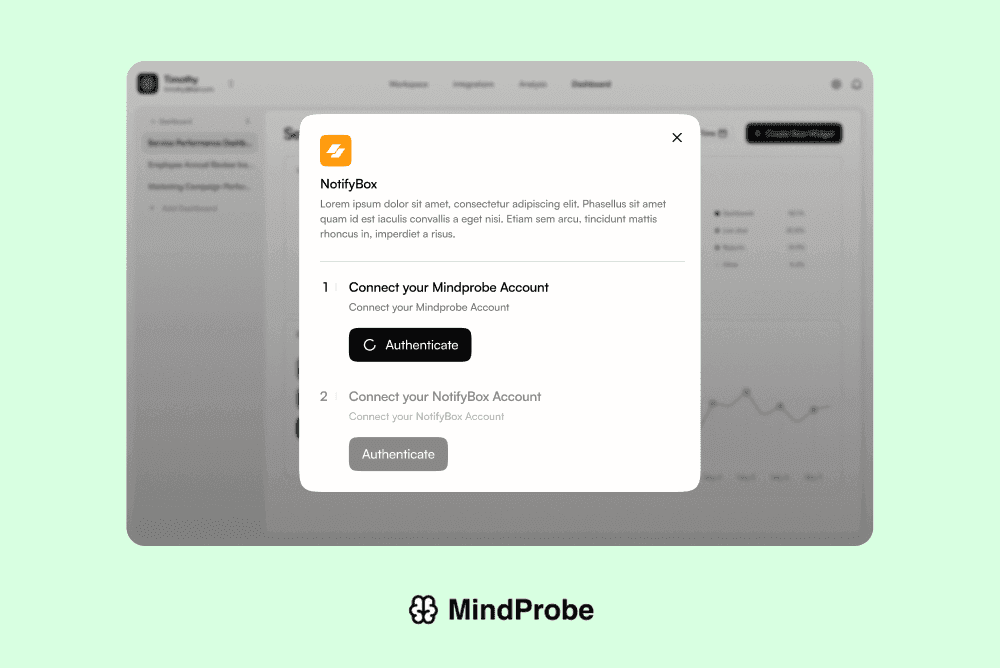
Pin notes and set threshold alerts; get email or Slack notifications.
Ready to power decisions with live insights?
Join thousands of companies already using MindProbe to gather valuable insights.