Loading...
Dive Deep with Cross-Tabulation Reports
Instantly generate crosstabs to explore relationships between any two (or more) variables in your survey data.
Surface hidden relationships, compare variables side by side instantly to reveal insights traditional reports miss.
Dive Deep with Cross-Tabulation Reports
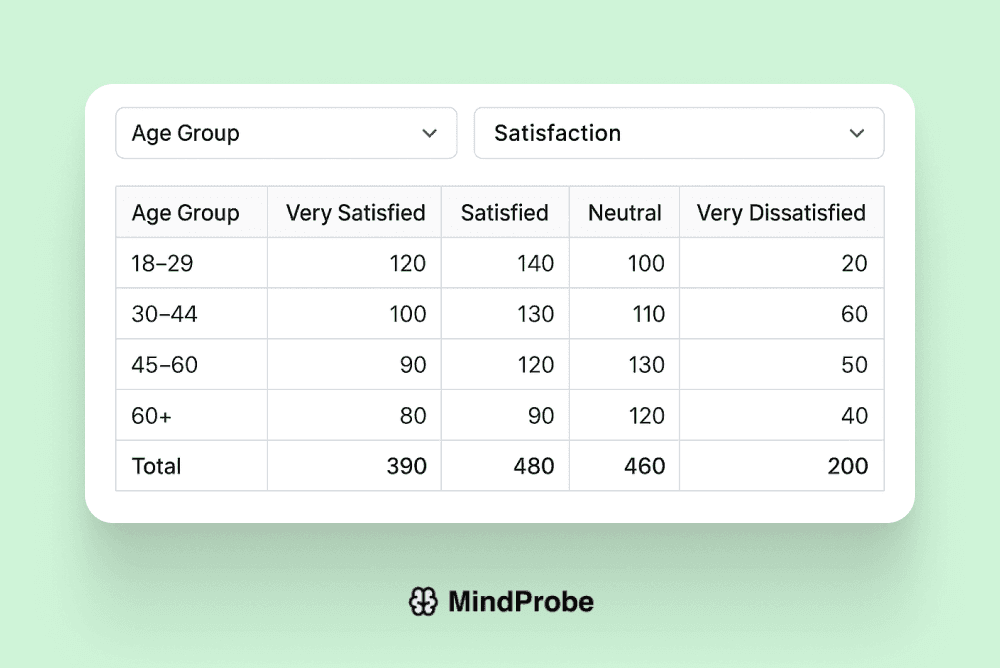
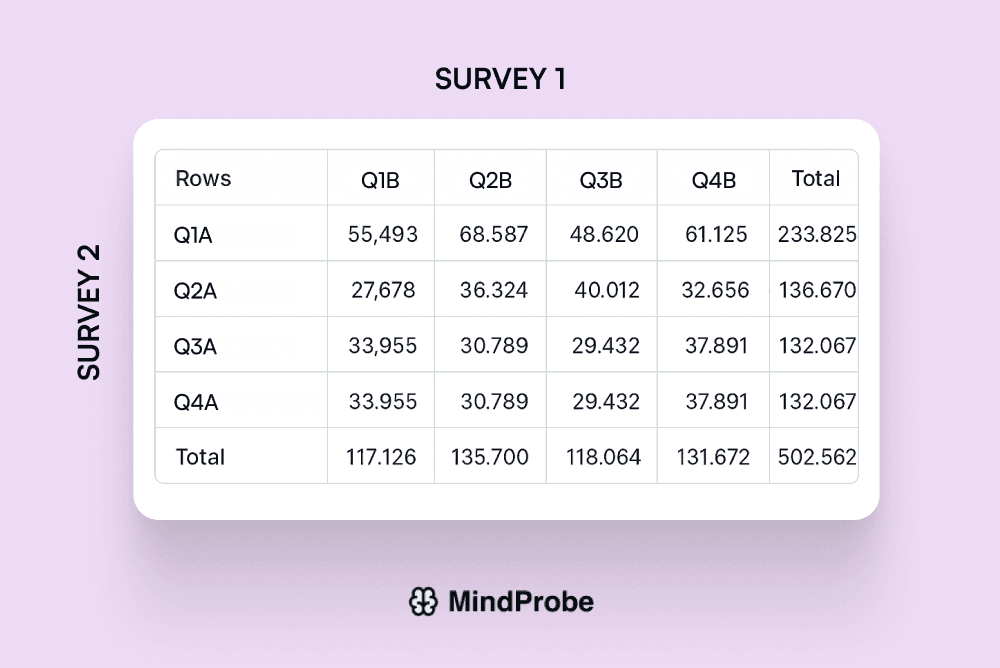
One-Click Crosstabs
Select any pair of variables demographic vs. response, time vs. sentiment and generate a formatted cross-tab in seconds. No Excel pivots needed.
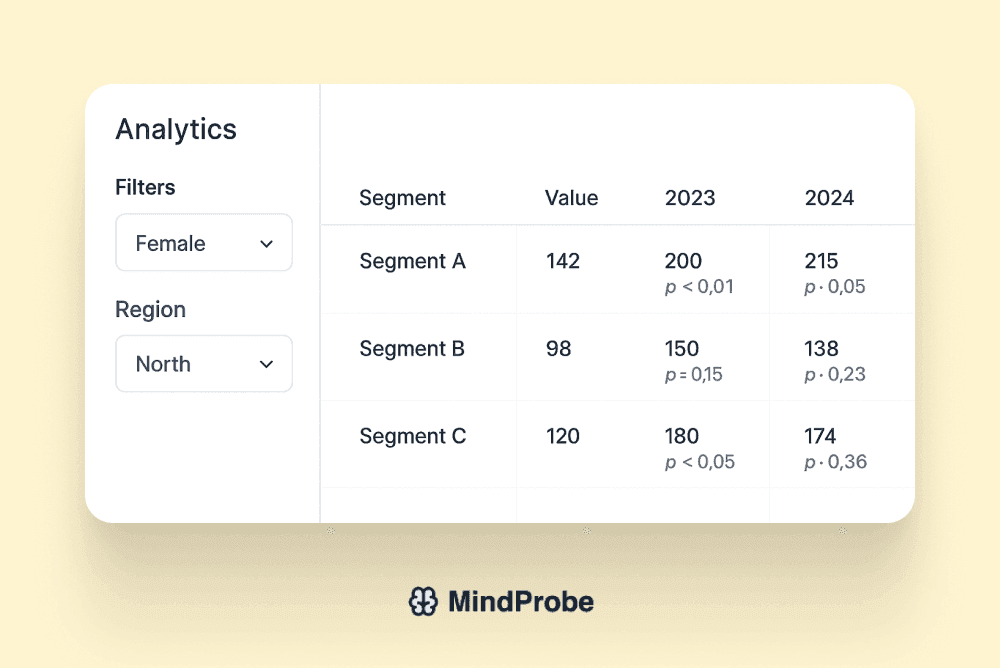
Custom Breakdowns
Add filters, weightings, and significance testing on the fly. Drill into subgroups or compare multiple cohorts side by side for deeper insights.
Visual Crosstab Charts
Convert tables into bar, stacked bar, or heatmap visualizations with one click. Highlight key comparisons automatically.
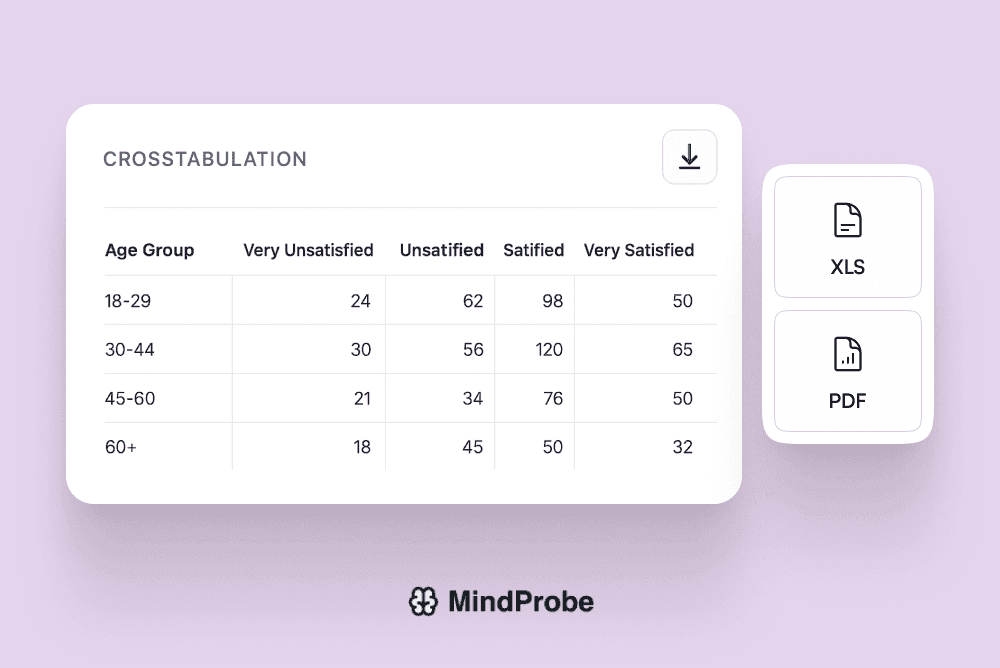
Export to PPT/CSV
Download crosstabs as CSV or embed in slide decks and dashboards
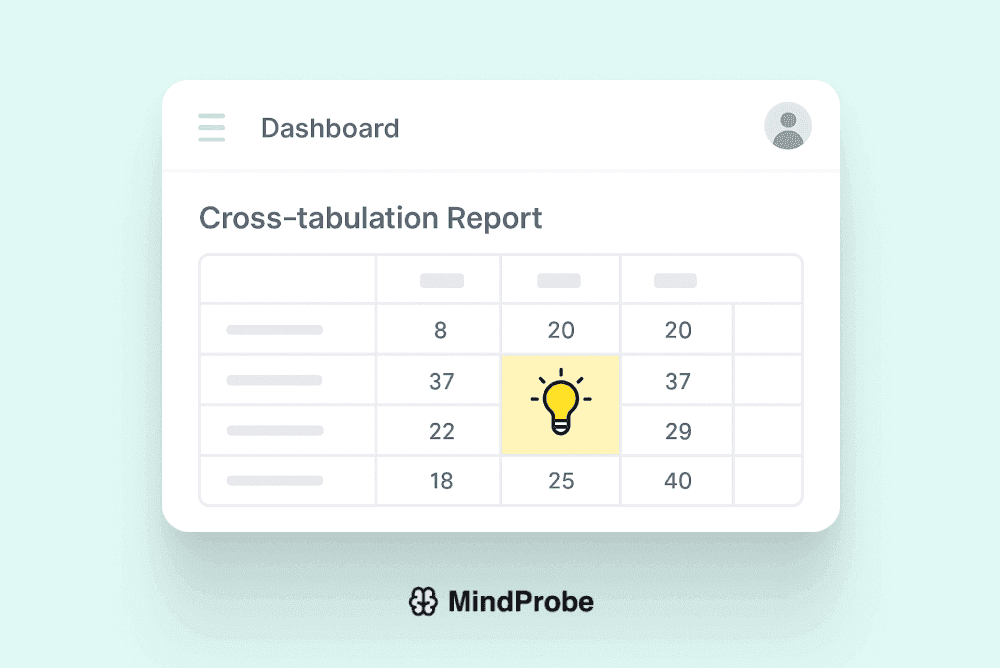
Automated Insights
AI highlights significant differences and flags anomalies.
Multi-Variable Analysis
Generate 3-way or 4-way crosstabs for deeper segmentation.
Ready to uncover hidden relationships in your data?
Join thousands of companies already using MindProbe to gather valuable insights.