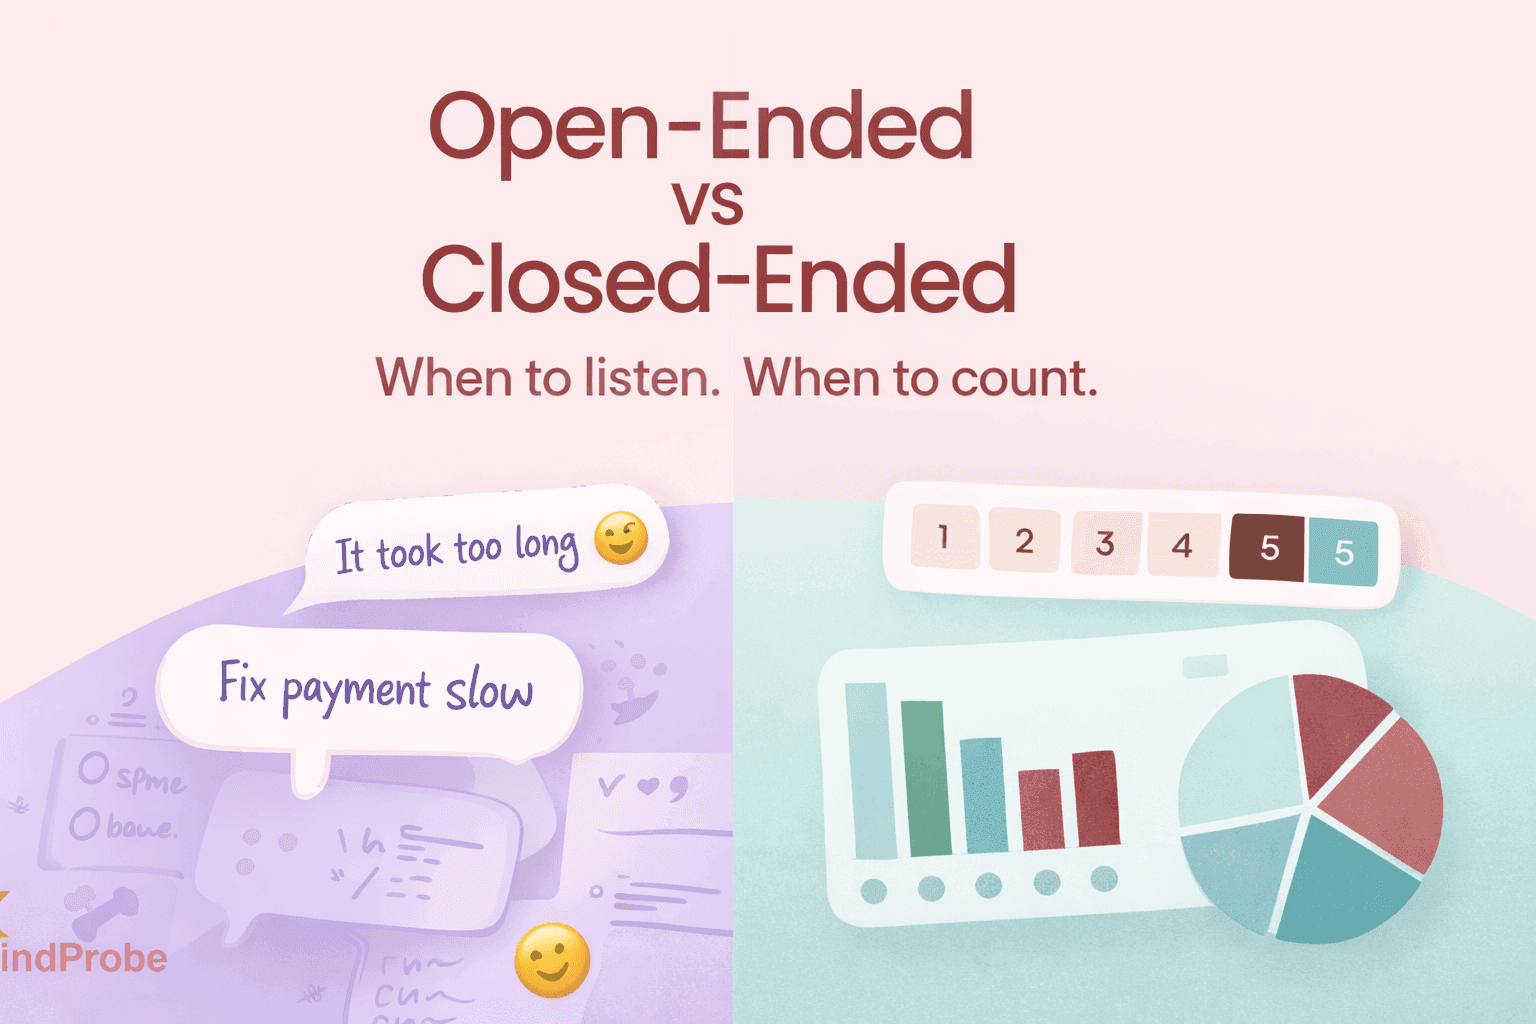
Open-Ended vs Closed-Ended Questions: When to Let Customers Speak and When to Count the Votes
Samee
Written for B2C marketing managers, product managers, market-research consultants, and anyone forced to justify “why the numbers suddenly tanked” in the next Monday stand-up.
1. Why This Topic Isn’t Just Academic
You’ve probably sat through at least one meeting where somebody waves a colorful dashboard and proclaims, “CSAT dropped three points any ideas why?” Cue the awkward silence. Numbers alone rarely explain behavior. On the flip side, a 20-page PDF of raw customer rants is equally useless when the C-suite wants a tidy KPI.
That’s the heart of the open- vs closed-ended debate. Get the mix wrong and you either drown in anecdotes or starve on sterile figures. Get it right and you’ll walk into meetings armed with the story and the score earning instant credibility with data folks and brand storytellers.
Key takeaway: open-ended questions uncover the why, closed-ended questions quantify the how many. Together they fuel better product, marketing, and CX decisions.
2. Open-Ended Questions Letting Customers Write the Script
2.1 What counts as “open-ended”?
Any prompt that doesn’t restrict the answer. Classic stems include “why,” “how,” “describe,” “tell us about.”
2.2 Why do B2C teams love them?
Customer feedback offers powerful real-world insights that can shape better experiences. During discovery, shoppers often reveal frictions you might never have considered for instance, noting that a “promo code box appears after the coupon expired.” Their language also provides emotional color, with words like “thrilled,” “meh,” or even strings of emojis showing the true intensity of their feelings perfect for refining your tone of voice. And within their comments lies a copy goldmine: customers sometimes write the best taglines themselves, such as “I love the ‘one-click re-order’ so convenient!”
Quick marketing use-case
Scenario: Post-purchase survey after first order.
Open-ended prompt: “What surprised or delighted you after unboxing?”
Outcome: 42 % mention “ eco-friendly packaging smell like fresh paper.” → new email campaign angle: “Eco inside, delight outside.”
2.3 The downsides
1. Coding overhead – someone (or something) must tag, group, and quantify the text.
2. Survey fatigue – each open box adds ~20 s to completion time on mobile.
3. Variance – one respondent writes a novel, another writes “ok”.
2.4 How MindProbe lightens the load
MindProbe’s auto-tagger groups phrases like “slow checkout,” “payment fail,” and pushes sentiment scores to a live dashboard. One client shaved 14 analyst hours per survey, redirecting that time into proactive UX fixes.
3. Closed-Ended Questions The Power of Fast, Crunchable Numbers
3.1 Definition & common formats
Feedback can take many useful formats, each suited to different insights. A binary question, such as “Did you find what you needed? Yes / No,” quickly gauges satisfaction. A Likert scale for example, “Rate delivery speed: 1 (poor) – 5 (excellent)” measures degrees of sentiment or performance. Multiple-choice questions like “How did you first hear about us? Instagram / Friend / Search” help identify key channels or behaviors. And ranking questions, such as “Order these features by importance,” reveal priorities and trade-offs in customer preferences.
3.2 Why they’re indispensable
1. Dashboard-ready – slides practically build themselves.
2. Benchmarkable – compare last quarter to this quarter, or UK vs US.
3. Lower dropout – tick-box speed on mobile.
3.3 Blind spots
- Surface-level – “50 % disliked checkout” but you still don’t know why.
- Risk of bias – unbalanced scales or missing answer choices skew data.
4. Decision Matrix: Five Rules for Picking the Right Format
When designing feedback questions, a few key rules help you choose the right format. Start with the research phase ask yourself, “Am I exploring or validating?” If you’re exploring, use open questions; if validating, stick to closed ones. Consider sample size: if more than 5,000 people will respond, lean toward mostly closed questions for easier analysis. Check your device mix if 70% of your traffic is mobile, keep open-ended questions to 20% or less to avoid fatigue. Under KPI pressure, when you “need a number for Monday,” prioritize closed questions for quick quantifiable data. Finally, assess your analysis capacity if you have AI text analytics, you can safely include more open questions without overwhelming your team.
5. Real-World Examples You Can Steal Today
5.1 E-commerce checkout friction
1. Closed gate: “Rate checkout ease 1–5.”
2. Branch: If ≤3 → open: “Which step felt clunky?”
3. Optional list: For quick quantification, show checkboxes: Address form, Payment, Promo code, Other.
5.2 Subscription box tired of churn
1. Closed: “How satisfied are you with snack variety? 1–5.”
2. Open follow-up for ratings ≤3: “Name two snacks you’d love to see next month.”
5.3 SaaS onboarding drop-off
1. Closed: “Did you complete the tutorial? Yes/No.”
2. Open (No only): “What stopped you?”
3. Closed multi-select: “Choose blockers: Too long / Jargon / Didn’t see value / Other.”
6. Branching Logic Blueprint
Goal: Keep surveys short for promoters and deep for detractors.
Q1 NPS rating (0-10)
│
├─ If 0-6 (Detractor)
│ ├─ Q2 open: “Tell us the main reason.”
│ └─ Q3 closed multi-select root-causes
│ └─ If “Other” → Q4 open text
│
└─ If 7-10 (Passive/Promoter)
└─ Q2 open (optional): “What wowed you?”
MindProbe tip: set these conditions visually; the platform shows a live map so you won’t accidentally trap users in an infinite loop.
7. Analyzing Open-Ended Data Without Losing Your Weekend
Step-by-step playbook
1. Export CSV (or stream via API into MindProbe).
2. Auto-tag with AI – clusters phrases (“size chart,” “promo code fail”).
3. Sentiment map – red = negative, green = positive, bubble size = theme frequency.
4. Demographic overlay – see if Gen Z in London is more annoyed by “delivery time” than Boomers.
5. Prioritize fixes – high-frequency + high-negativity themes to the top of the sprint backlog.
Data point: A DTC cosmetics brand shaved 1.3 days off its monthly reporting cycle after ditching manual coding in favor of MindProbe’s auto-tagger.
8. Common Pitfalls & Quick Fixes
Poorly designed surveys can easily distort results but a few simple fixes prevent common pitfalls. Leading wording like “Don’t you love…” creates fake positivity, so use neutral verbs such as “Rate” or “Describe” instead. Overlapping scale labels cause confusion; make sure to clearly label both endpoints and mid-points. Having too many open text boxes often leads to dropouts, especially on mobile limit them to a maximum of two and use branching questions where possible. Finally, skipping a pilot test risks logic errors and broken flows, so always test your survey with at least five staff members across different devices before launch.
9. Mini Case Studies: Fashion, Snacks, and SaaS
9.1 Fashion e-commerce
- Problem: 18 % returns, mostly “wrong fit.”
- Survey mix: 1 closed, 1 open.
- Insight: The phrase “shorter than expected” appeared in 34 % of open answers.
- Fix: Added model height images + size advisory widget.
- Result: Returns fell to 13 % in six weeks.
9.2 Snack subscription
- Problem: Churn spikes after third box.
- Survey: Closed scale + open snack suggestion.
- Insight: Users wanted high-protein, low-sugar items.
- Fix: Introduced “Protein Pack” line.
- Result: Churn halved, referral codes up 22 %.
9.3 SaaS project tool
- Problem: 40 % of free-trial users never activate.
- Survey: Closed yes/no + open blocker.
- Insight: 63 % cited “Zapier integration unclear.”
- Fix: Added a GIF tutorial + inline tips.
- Result: Activation rose 12 pts, support tickets down 20 %.
10. FAQ Rapid-Fire Answers for Busy Teams
Q: How many open-ended questions can I safely ask on mobile?
A: Two max. Anything more risks fatigue; rely on branching.
Q: Is AI coding as accurate as humans?
A: MindProbe’s model hits ~90 % agreement with professional coders. Use human review for edge cases.
Q: Should I randomize answer options?
A: Only when order bias could matter e.g., picking new flavors. For scales, keep logical order.
Q: Can I embed images in open-ended prompts?
A: Yes image-based surveys increase engagement, but compress files for quick loading.
11. Action Checklist
1. Audit existing surveys calculate your open:closed ratio.
2. Insert branching to keep forms short for happy users and deep for detractors.
3. Activate auto-tagging with MindProbe; set up weekly sentiment alerts.
4. Fix quick wins first delivery messaging, size charts, login copy.
5. Measure: compare NPS, CSAT, churn after changes.
6. Iterate: drop, tweak, or replace under-performing questions.
12. Final Thoughts
Open-ended questions reveal the why; closed-ended questions quantify the how many. In an era where marketing budgets tighten and product cycles accelerate, you can no longer pick one and ignore the other. Use branching logic to combine them elegantly, deploy AI text analysis to keep workload sane, and feed insights straight into sprint boards. The payoff? Faster iteration, lower churn, and most important customer voices that actually guide your brand’s story.
Ready to act? Spin up a new survey in MindProbe, drag that branching arrow, and watch your response rates climb while analysis time plummets.