The Complete Likert Scale Guide: Examples, Tips and Best Practices

Samee
Every list of Likert scale examples traces back to one monograph. In 1932 Rensis Likert, a Columbia doctoral student, published "A Technique for the Measurement of Attitudes" in the Archives of Psychology, number 140 (Wellcome Collection record). The leading method then, Louis Thurstone's, needed panels of judges to sort statements first. Likert dropped the judges. Respondents simply marked each statement on five steps, from "strongly approve" through "undecided" to "strongly disapprove", and the steps were scored 1 to 5.
Key Takeaways
- A Likert item is one statement with ordered response anchors. A Likert scale is several items summed or averaged to measure one attitude.
- Five points suit most surveys, especially on mobile. Seven points add precision for expert or repeat audiences.
- Label every point, keep the midpoint genuinely neutral and match the anchor set to the question.
- Report distributions, medians and top-2-box first; means suit multi-item scales.
- Chart results as a diverging stacked bar.
What is a Likert scale?
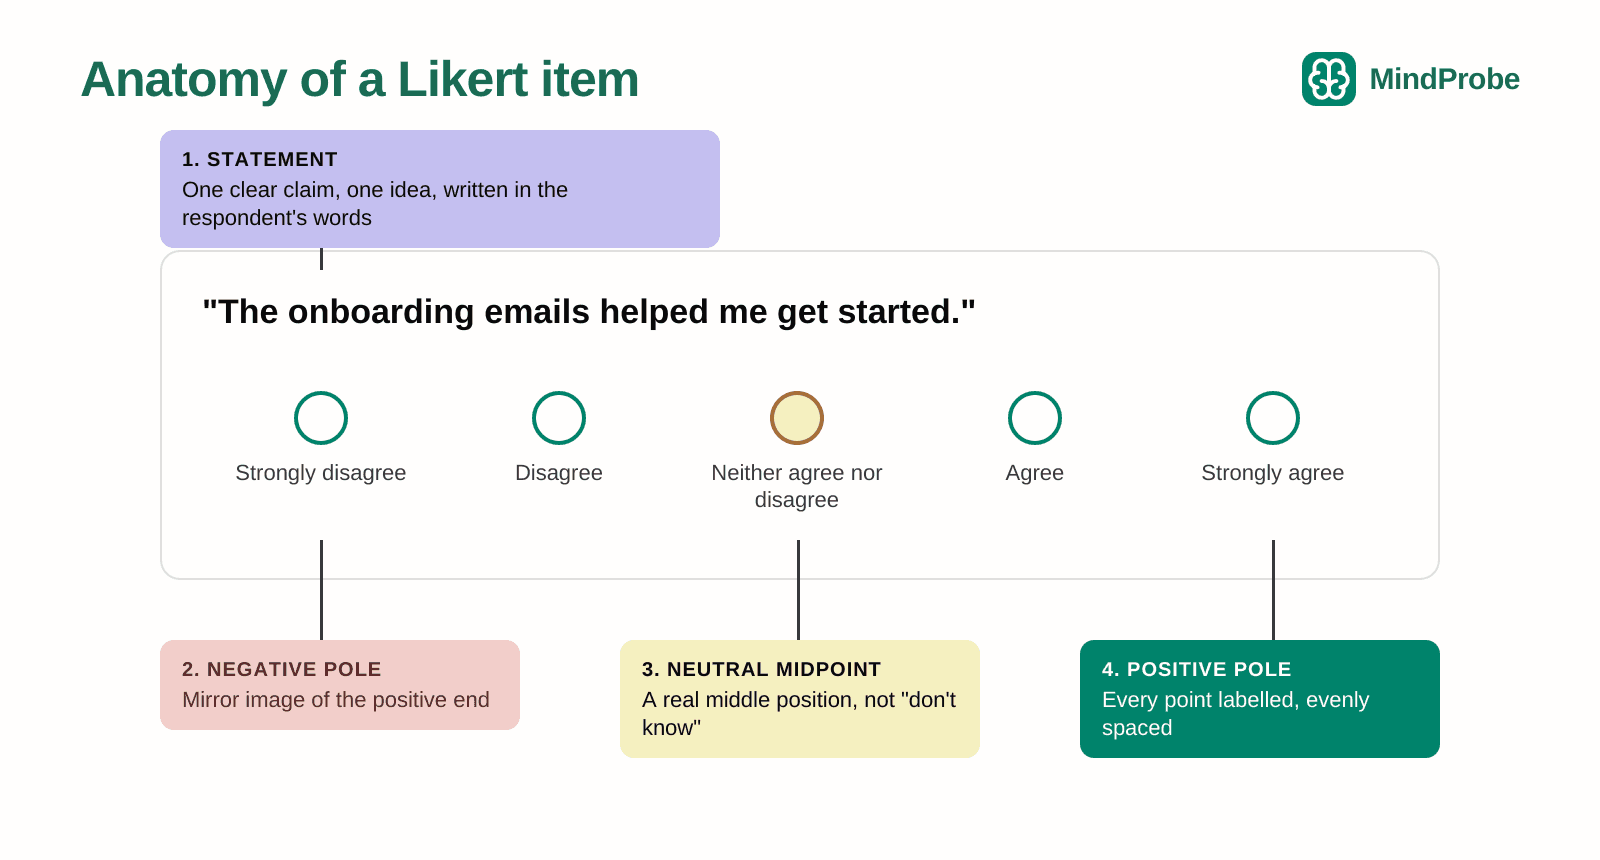
A Likert scale is a set of statements, each answered on the same ordered agreement scale, whose scores are combined to measure one underlying attitude, such as trust in a brand or satisfaction with a service.
People call any 1 to 5 question a Likert scale, which muddles analysis later. Keep three terms apart:
- Likert item: a single statement with ordered response options, usually agree to disagree. "The app is easy to use" with five anchors is one item.
- Likert scale: the combined score from several items that tap the same construct. Likert's own method summed responses across statements, which is what makes it a scale.
- Rating scale: the broader family. Star ratings, 0 to 10 scores and frequency scales are all rating scale formats; a Likert item is one kind.
So a ten-statement engagement battery is a Likert scale; a lone "How satisfied were you?" is a rating question. For a short definition you can link colleagues to, see our Likert scale glossary entry. For where Likert items sit among every other format, the complete guide to survey question types maps the whole family.
Should you use a 5-point or 7-point Likert scale?
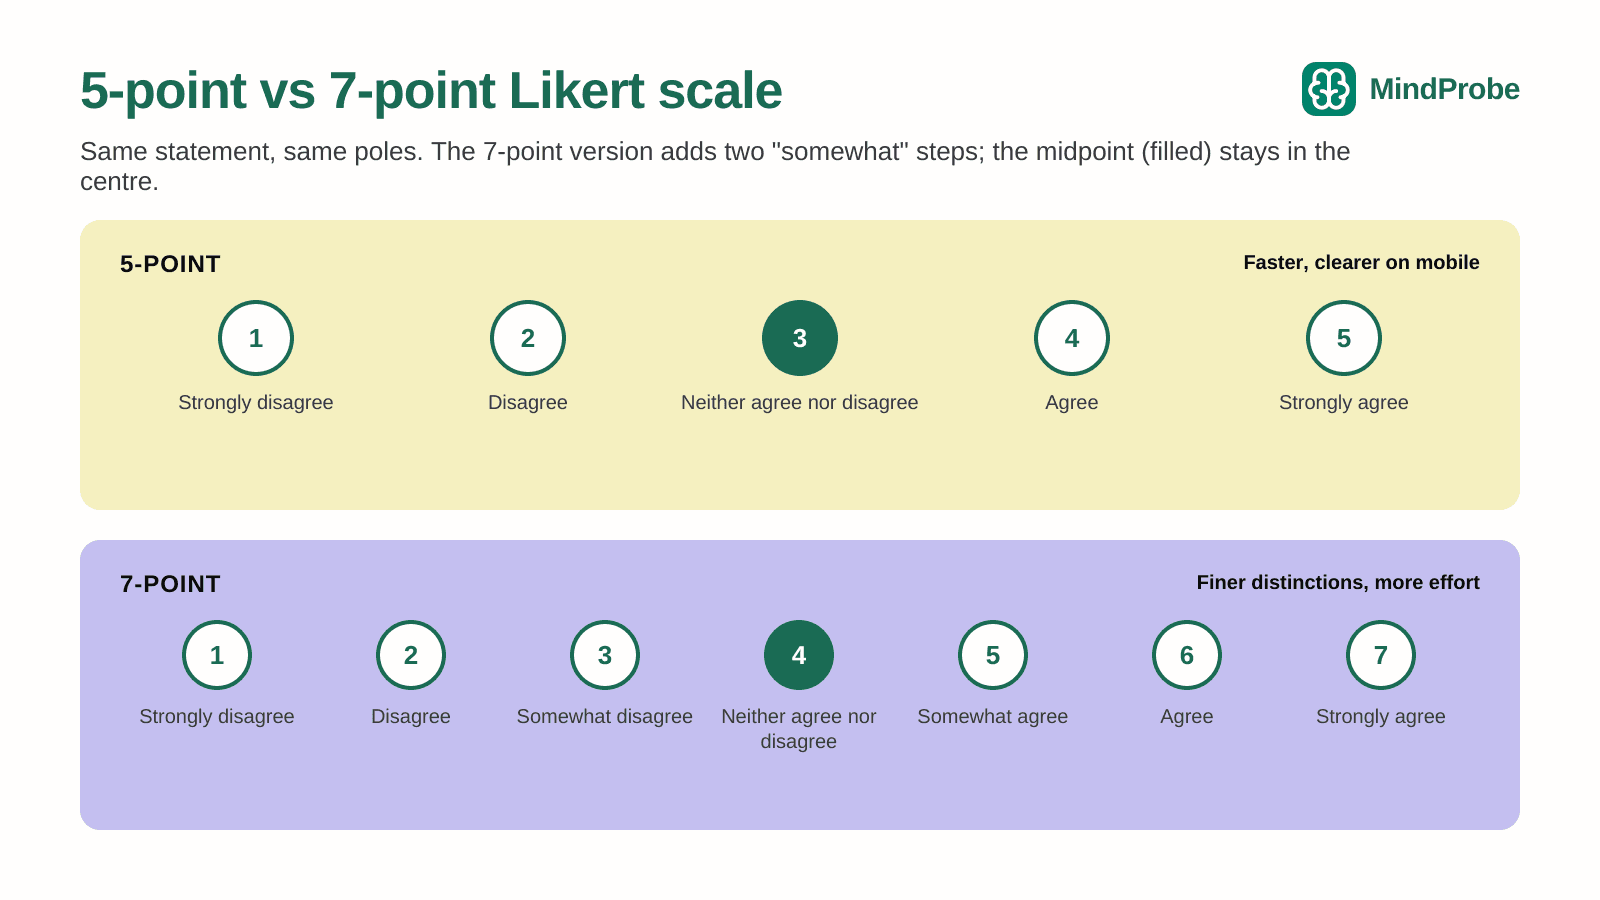
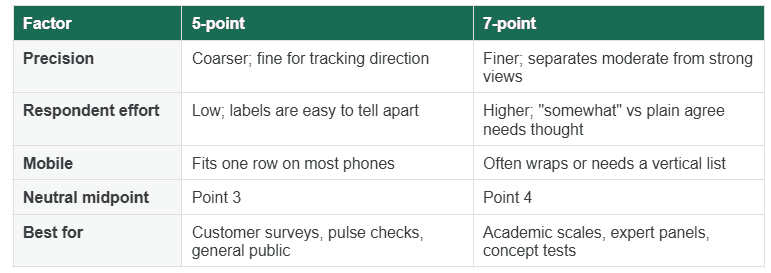
Use five points by default. Choose seven when respondents are experienced and you need finer resolution between moderate and strong views.
The evidence points two ways. Preston and Colman (2000) tested scales from 2 to 11 points with 149 respondents. Two, three and four points performed poorly; reliability, validity and discriminating power rose up to around seven points; test-retest reliability tended to fall beyond ten; and respondents themselves preferred the 10-point version, with 7 and 9 close behind. Working with European Social Survey experiments, Revilla, Saris and Krosnick (2014) reached a narrower conclusion for agree-disagree items specifically: five categories gave better quality data than seven or eleven.
EXPERT PERSPECTIVE
Revilla, Saris and Krosnick analysed multitrait-multimethod experiments from round three of the European Social Survey and concluded that agree-disagree items should offer five answer categories rather than seven or eleven, because the longer versions produced lower-quality data.
HOW MINDPROBE HELPS
Set the scale once and keep it. MindProbe's rating and Likert question types let you choose 5 or 7 points, label every anchor and reuse the same scale in each wave, so your trend lines stay comparable.
Standard Likert anchor sets
Agreement is the classic. Pick the dimension the question is really about, then use its standard anchors.
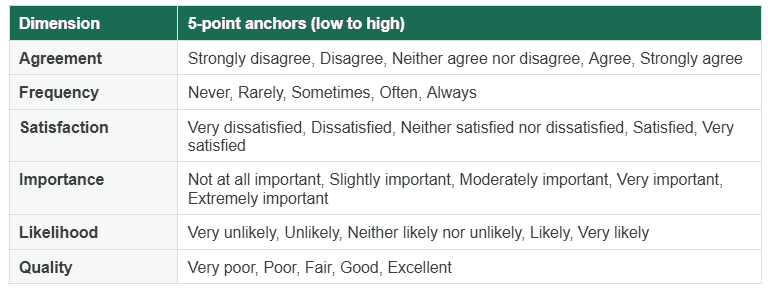
Importance and quality sets are unipolar, so their middle point is not a neutral opinion. Remember that when reporting "neutral" shares.
Likert scale examples for five research contexts
The best Likert scale examples share one habit: the statement names a concrete experience, and the anchors match what is being asked.
Each of these Likert scale examples shows the wording, anchors and why it works. Rebuild any of them in MindProbe, whose 30+ question types include Likert and matrix formats, or start from the survey templates.
1. Customer satisfaction and CX
Finding the right size on our website was easy.
- Strongly disagree
- Disagree
- Neither agree nor disagree
- Agree
- Strongly agree
2. Employee engagement
In the last month, how often have you received useful feedback from your manager?
- Never
- Rarely
- Sometimes
- Often
- Always
3. Product and concept testing
This product would solve a problem I currently have.
- Strongly disagree
- Disagree
- Somewhat disagree
- Neither agree nor disagree
- Somewhat agree
- Agree
- Strongly agree
4. Brand perception
[Brand] is a brand I trust with my personal data.
- Strongly disagree
- Disagree
- Neither agree nor disagree
- Agree
- Strongly agree
Education or healthcare
How satisfied were you with the explanation of your treatment options?
- Very dissatisfied
- Dissatisfied
- Neither satisfied nor dissatisfied
- Satisfied
- Very satisfied
To turn these Likert scale examples into a real Likert questionnaire, write four to six statements on the same construct rather than a loose set of opinions.
How do you write good Likert items?
Write one idea per statement, label every point, keep the scale balanced and use the same direction throughout the questionnaire.
- One idea per statement."Delivery was fast and well packaged" is two questions. Split it.
- Label every point, not only the ends. Fully labelled scales remove guesswork about what a 2 means.
- Balance the poles. Two positive and two negative options around a real midpoint; never "Poor, Fair, Good, Very good, Excellent" sold as balanced.
- Keep "Don't know" separate from the midpoint, as an off-scale option, so you can exclude it in analysis.
- Watch acquiescence. Long agree-disagree grids invite yes-saying, a form of response bias. Break them up.
Whether a Likert item is the right tool comes first; our comparison of open-ended and closed-ended questions covers that call. For the full wording framework, read how to write good survey questions.
How to analyse Likert scale data
Treat single Likert items as ordinal: report the distribution, median, mode and top-2-box percentage. Summed multi-item scales can reasonably be analysed with means and parametric tests.
This is the oldest argument in the field. Jamieson (2004) argued in Medical Education that Likert categories have an order but no guaranteed equal spacing, so medians, modes and non-parametric tests are the safe choice. Norman (2010) replied that parametric methods such as t-tests, ANOVA and regression hold up well with Likert data, citing studies going back to the 1930s. Both can be right: Jamieson's caution fits single items; Norman's case is strongest for summed scales.
A worked example (illustrative numbers)
Suppose 200 shoppers rate "Checkout was easy" on five points. These figures are made up to demonstrate the calculation, not research data.
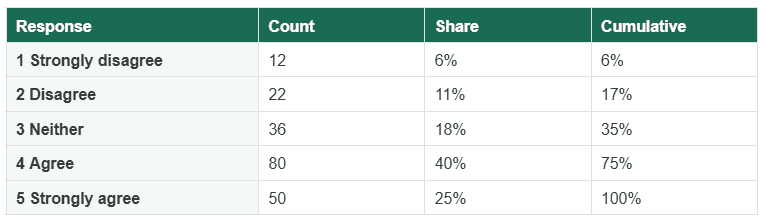
- Median: the 100th and 101st answers both fall in "Agree", so the median is 4.
- Mode:"Agree" (80 responses).
- Top-2-box: 40% + 25% = 65% agree; bottom-2-box is 17%.
- Mean: 3.67, reported beside the distribution, never instead of it.
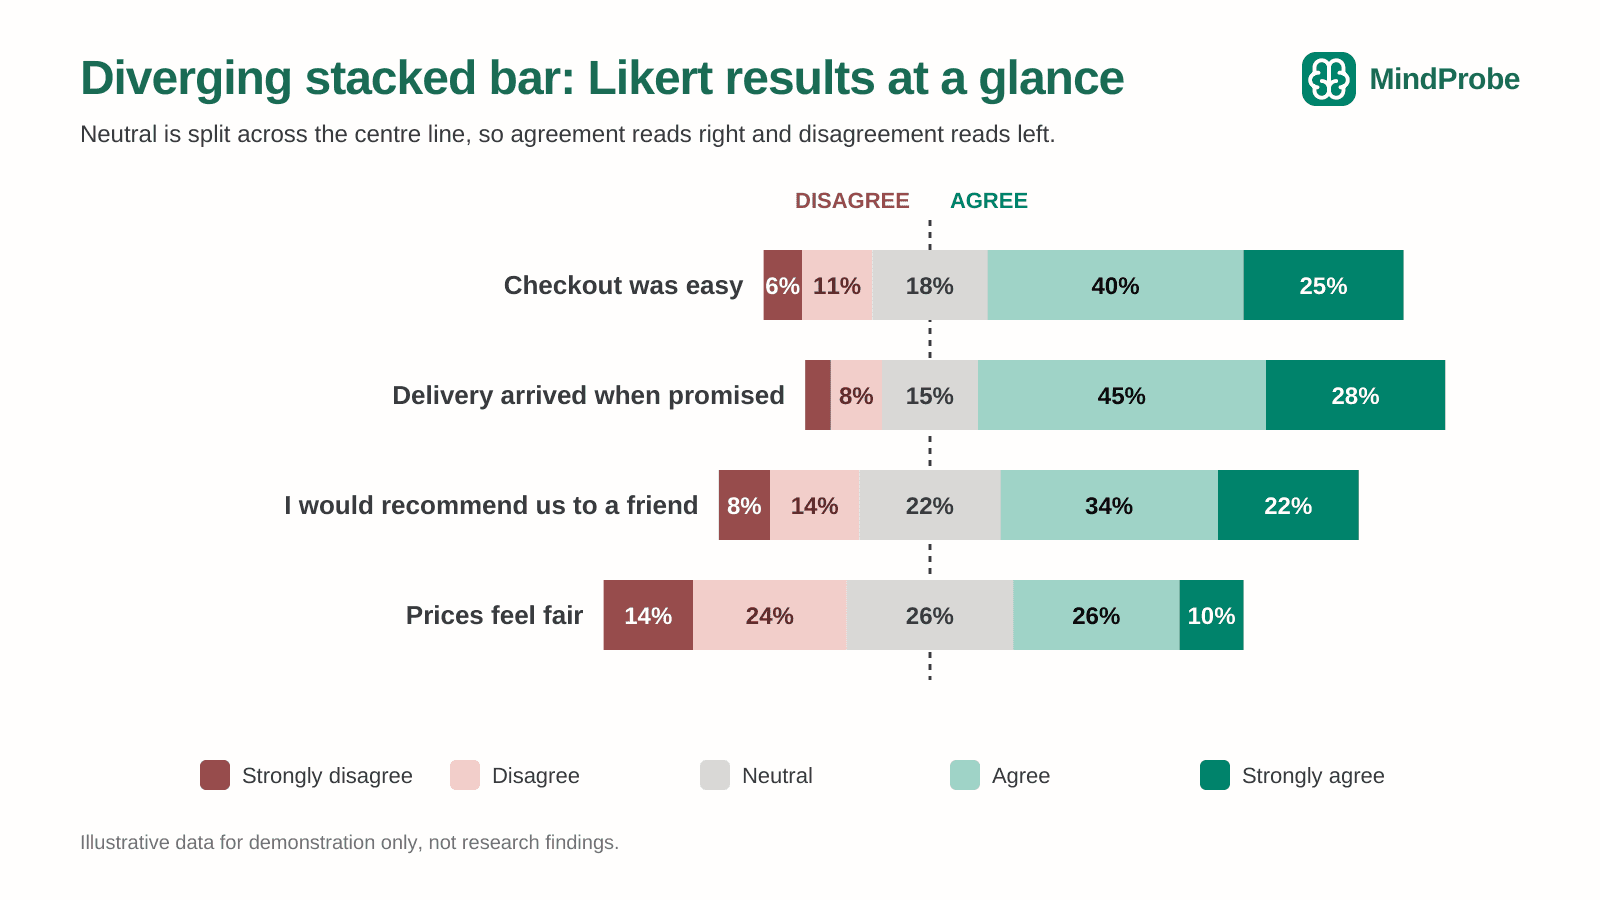
For charts, Heiberger and Robbins (2014) recommend the diverging stacked bar as the primary display for Likert data: neutral sits across a centre line, agreement extends right and disagreement left, so several items compare at a glance. MindProbe's live dashboards can segment that view, say new versus returning customers.
HOW MINDPROBE HELPS
In MindProbe, Likert results update in a live dashboard as responses come in, with the full distribution on show and a split by segment one click away. Add an open "why?" after the item and AI sentiment analysis summarises the reasons behind the scores.
Common Likert scale mistakes (and fixes)
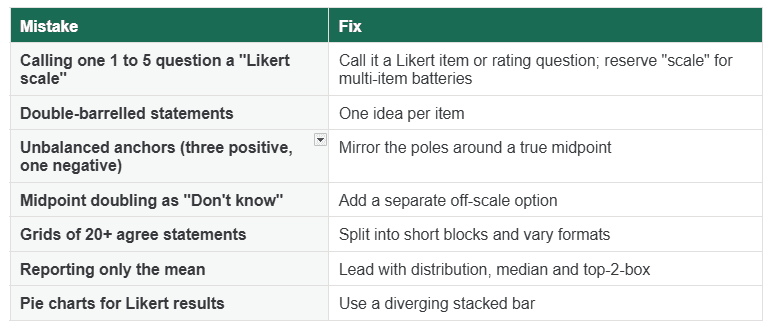
If a question has fixed answers but no natural order, it belongs to a different family; see close-ended question formats.
Frequently Asked Questions
What are some good Likert scale examples?
"Finding the right size on our website was easy" (agreement), "How often do you receive useful feedback?" (frequency) and "How satisfied were you with the explanation?" (satisfaction) are all strong Likert scale examples because each targets one concrete experience.
Is a Likert scale the same as a rating scale?
No. A Likert scale is one type of rating scale: several agreement-style items combined to measure a single attitude. Star ratings and 0 to 10 scores are rating scales but not Likert scales.
Should a Likert scale have a neutral option?
Usually. A true midpoint lets people with no view say so. Keep "Don't know" separate.
Can I calculate a mean from Likert data?
For a summed multi-item scale, most researchers accept means and parametric tests (Norman, 2010). For single items, lead with the median, mode and top-2-box.
How many items should a Likert questionnaire have?
Four to six items per attitude is a workable range for most commercial surveys.
Build your Likert questionnaire in minutes
Start from AI-generated questions or a template, distribute by link, email, QR or in-app, and watch live dashboards fill as responses arrive.
References
- Likert, R. (1932). A technique for the measurement of attitudes. Archives of Psychology, 140, 1 to 55.
- Ferguson, L. W. (1941). A study of the Likert technique of attitude scale construction. Journal of Social Psychology, 13, 51 to 57.
- Preston, C. C., & Colman, A. M. (2000). Optimal number of response categories in rating scales: reliability, validity, discriminating power, and respondent preferences. Acta Psychologica, 104(1), 1 to 15. doi:10.1016/S0001-6918(99)00050-5
- Revilla, M. A., Saris, W. E., & Krosnick, J. A. (2014). Choosing the number of categories in agree-disagree scales. Sociological Methods and Research, 43(1), 73 to 97. doi:10.1177/0049124113509605
- Jamieson, S. (2004). Likert scales: how to (ab)use them. Medical Education, 38(12), 1217 to 1218. doi:10.1111/j.1365-2929.2004.02012.x
- Norman, G. (2010). Likert scales, levels of measurement and the "laws" of statistics. Advances in Health Sciences Education, 15(5), 625 to 632. doi:10.1007/s10459-010-9222-y
- Heiberger, R. M., & Robbins, N. B. (2014). Design of diverging stacked bar charts for Likert scales and other applications. Journal of Statistical Software, 57(5), 1 to 32. doi:10.18637/jss.v057.i05